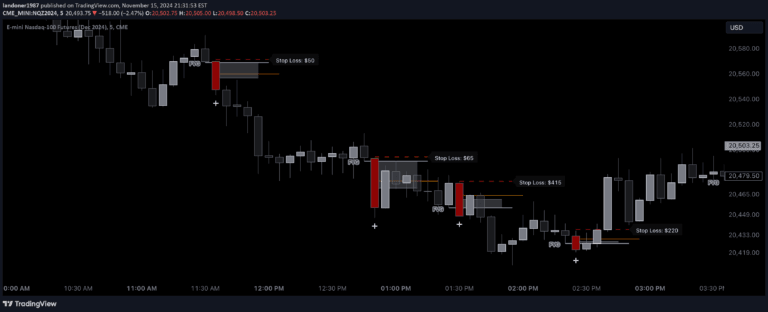
A trading signal that identifies dominant bars where the bar's range completely contains the subsequent bars, with arrow markers indicating potential trend breaks.
Explore complementary indicator rolesHow it works
The dominant bar signal identifies a specific bar formation where the high is higher than the next x bars and the low is lower than the next x bars. This means the entire range of subsequent bars is completely contained within the original dominant bar's range. When this condition is met, the indicator plots an arrow to highlight the potential significant price movement or trend break.
Traders can customize the number of subsequent bars (x) to adjust the sensitivity of the signal. The arrow typically indicates the direction of the potential breakout, helping traders identify moments when the current price range might be disrupted by a more significant market move.
Why it may be useful
The dominant bar signal provides traders with a visual representation of potential trend changes and market consolidation periods. By identifying bars that completely contain subsequent price action, traders can spot moments of market compression that often precede significant price movements. This can help in making more informed entry and exit decisions.
The signal is particularly useful for traders seeking to identify potential breakout opportunities and moments of market indecision. By highlighting bars that demonstrate strong price control, the indicator helps traders recognize when the market might be preparing for a substantial directional move.
When to explore it
The dominant bar signal works best in markets with clear trending characteristics and during periods of price consolidation. It is most effective when used in conjunction with other technical analysis tools to confirm potential trade setups. Traders should look for dominant bars in contexts where price has been ranging or showing signs of potential reversal.
The signal is particularly valuable in volatile markets where price compression can lead to significant breakouts. Traders should pay special attention to dominant bars that appear after extended price movements or near key support and resistance levels, as these can often indicate potential trend changes or continuation patterns.
Keep exploring
What we’ve verified
Access, alerts and repainting behaviour have not been independently verified for this indicator. Check the creator’s current publication and settings.
General descriptions and classifications are recovered research. Verified details above identify the specific checks we have completed. Check the creator’s current publication for later changes.