A trading indicator that identifies significant price drops in altcoins, highlighting potential market weakness through customizable 'dump' candle analysis.
Explore complementary indicator rolesHow it works
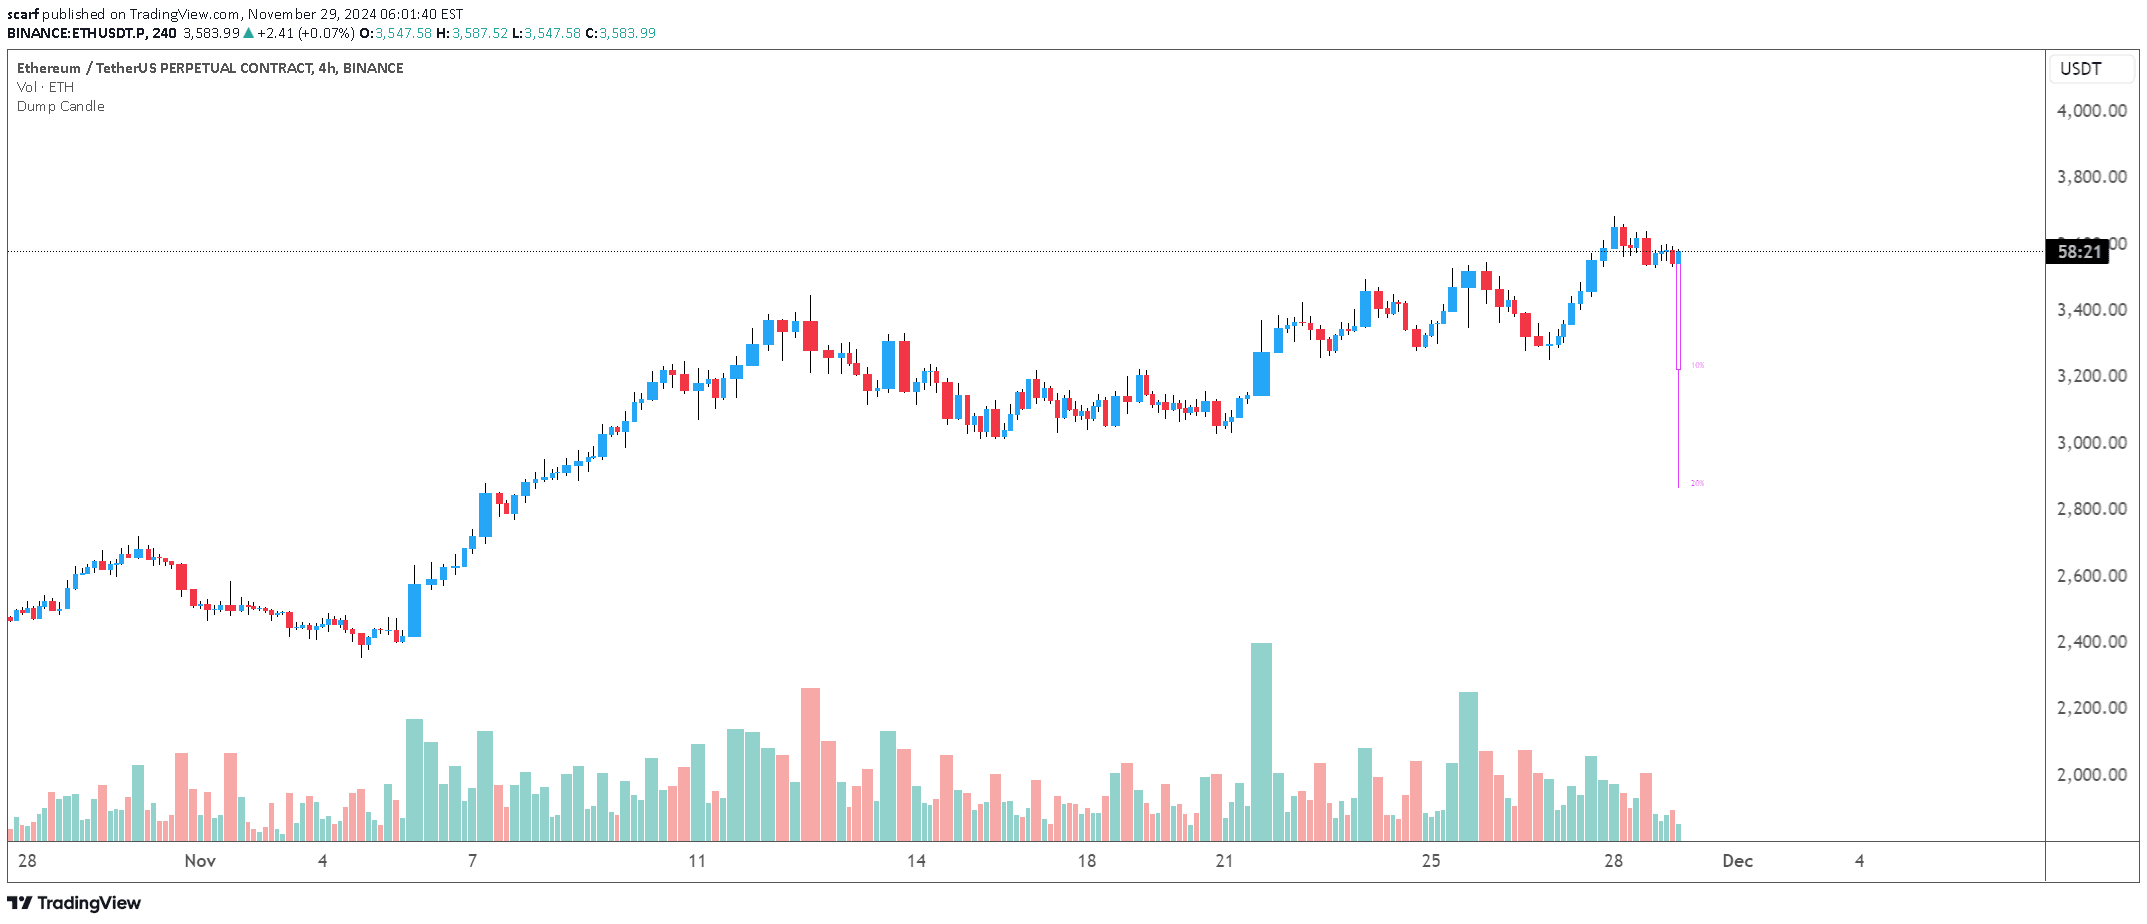
The Dump Candle indicator analyzes price charts to identify candles with substantial percentage drops, creating a visual representation of market sell-offs. Traders can customize the percentage drop threshold to define what constitutes a dump candle, allowing for flexible market analysis.
The tool highlights historical dump candles and calculates the average percentage drop from the five most recent occurrences. A label is displayed next to the most recent dump candle, providing key information such as the percentage drop, number of candles since the last dump, and the average dump percentage.
Why it may be useful
The Dump Candle indicator provides traders with a valuable tool for understanding market dynamics and potential price reversals. By visualizing significant price drops, traders can gain insights into market sentiment and potential selling pressure in altcoin markets.
This indicator helps traders identify potential entry points during market volatility, particularly when Bitcoin experiences minor fluctuations that can trigger altcoin sell-offs. The customizable nature of the tool allows traders to adapt their analysis to different market conditions and trading styles.
When to explore it
The Dump Candle indicator is most effective during periods of high market volatility and when trading altcoins that are sensitive to Bitcoin's price movements. Traders can use this tool to identify potential buying opportunities during short-term price drops, particularly when the market shows signs of quick recovery.
It is particularly useful for traders looking to set strategic buy orders at support levels, such as moving averages, fair value gaps, or order blocks. The indicator can help traders capitalize on quick market rebounds and identify potential entry points during temporary market weaknesses.
Keep exploring
What we’ve verified
Access, alerts and repainting behaviour have not been independently verified for this indicator. Check the creator’s current publication and settings.
General descriptions and classifications are recovered research. Verified details above identify the specific checks we have completed. Check the creator’s current publication for later changes.