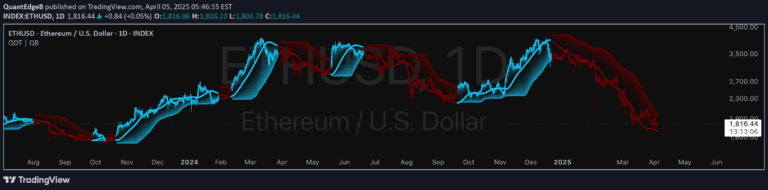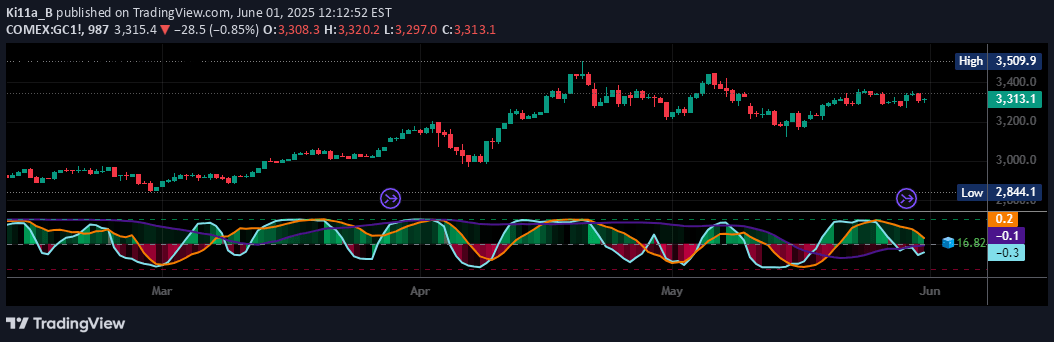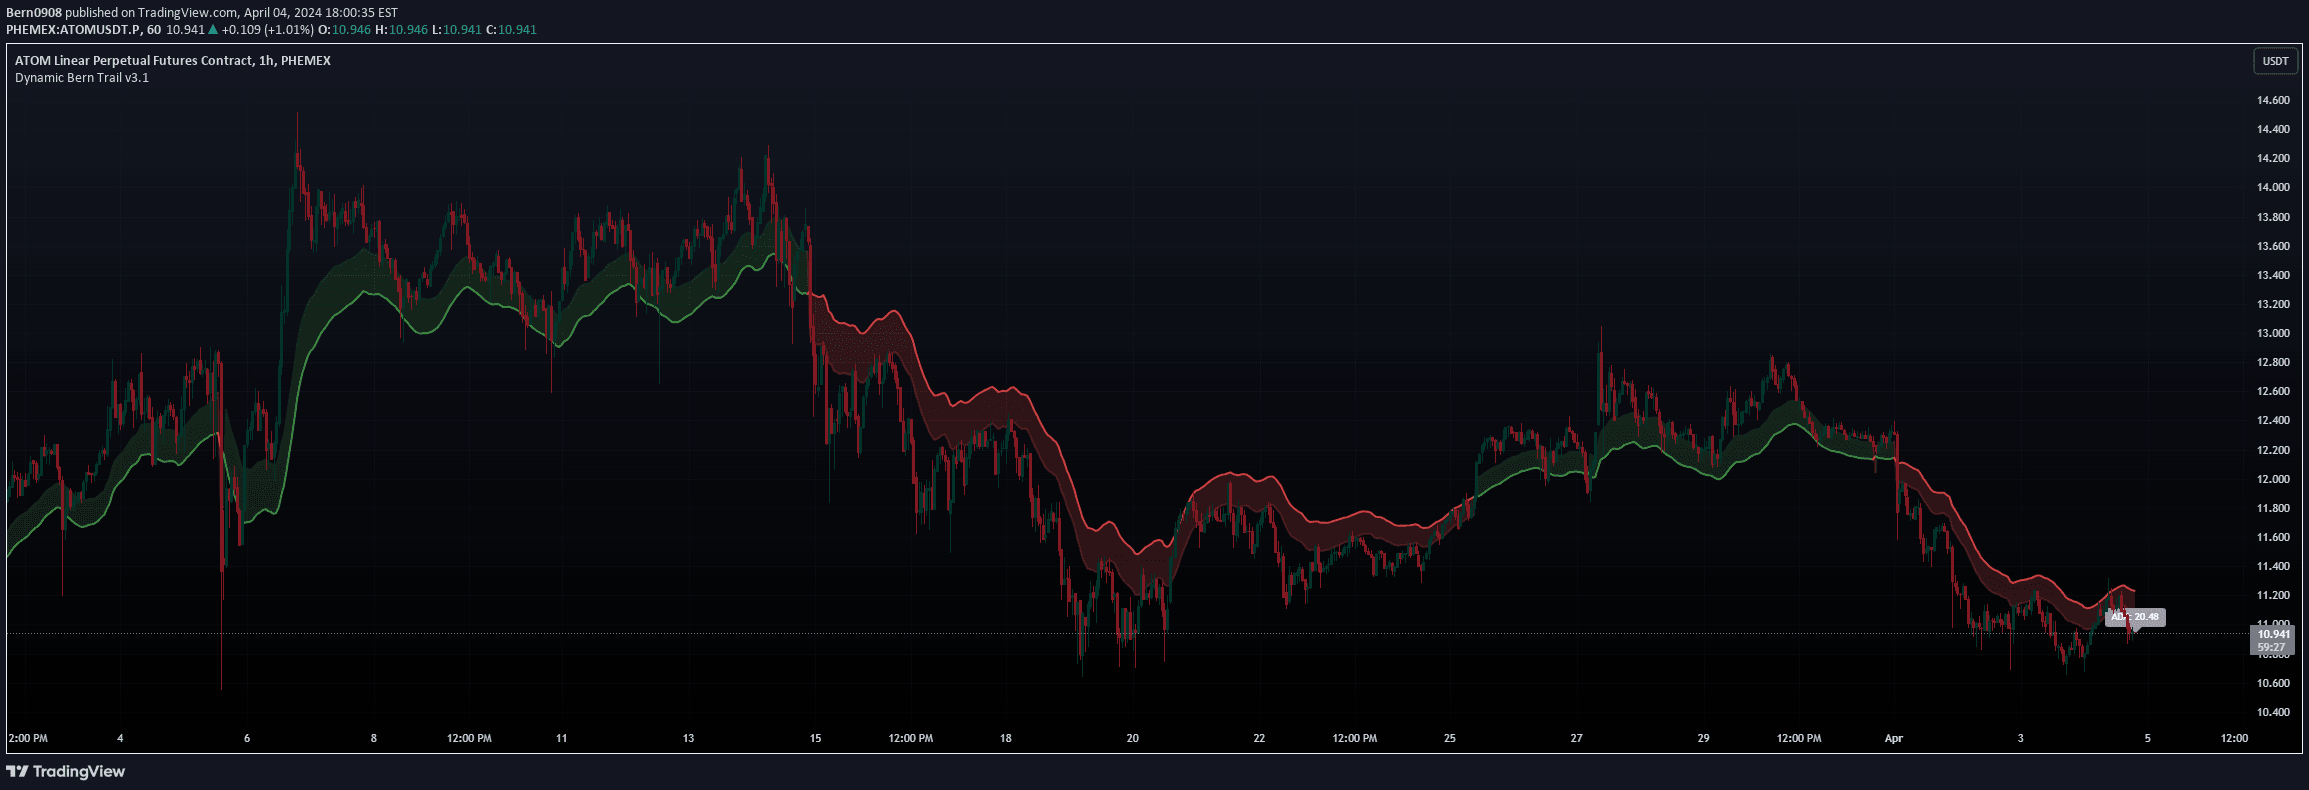
A dynamic trading indicator using ATR and EMA to track price movements and identify potential trend reversals or breakouts across different market conditions.
Explore complementary indicator rolesHow it works
The indicator calculates price movements by integrating Average True Range (ATR) and Exponential Moving Average (EMA) with a smoothing mechanism. It creates a dynamic trail that adapts to market volatility, using ATR length, multiplier, and EMA parameters to generate responsive signals.
By incorporating a buffer zone, the indicator helps traders identify potential trend reversals and breakout points. The custom settings allow traders to fine-tune the sensitivity and responsiveness of the signal based on specific asset characteristics and market conditions.
Why it may be useful
This indicator provides traders with a versatile tool for understanding market dynamics across different timeframes and asset classes. By combining volatility and trend measurements, it offers insights into potential price movements and helps traders make more informed decisions.
The flexible configuration allows traders to adapt the signal to various market conditions, making it valuable for different trading styles and strategies. Its ability to highlight potential reversals and breakouts can help traders manage risk and identify promising entry and exit points.
When to explore it
The indicator works best in markets with clear trending or ranging characteristics, where price movements show consistent patterns and volatility. It is particularly effective for traders seeking to capture multi-directional market movements and identify potential trend changes.
Traders can optimize the indicator's performance by adjusting its parameters to match the specific characteristics of their trading asset. It is most useful when combined with other technical analysis tools and when used across multiple timeframes to confirm signal reliability.
Keep exploring
What we’ve verified
Access, alerts and repainting behaviour have not been independently verified for this indicator. Check the creator’s current publication and settings.
General descriptions and classifications are recovered research. Verified details above identify the specific checks we have completed. Check the creator’s current publication for later changes.