
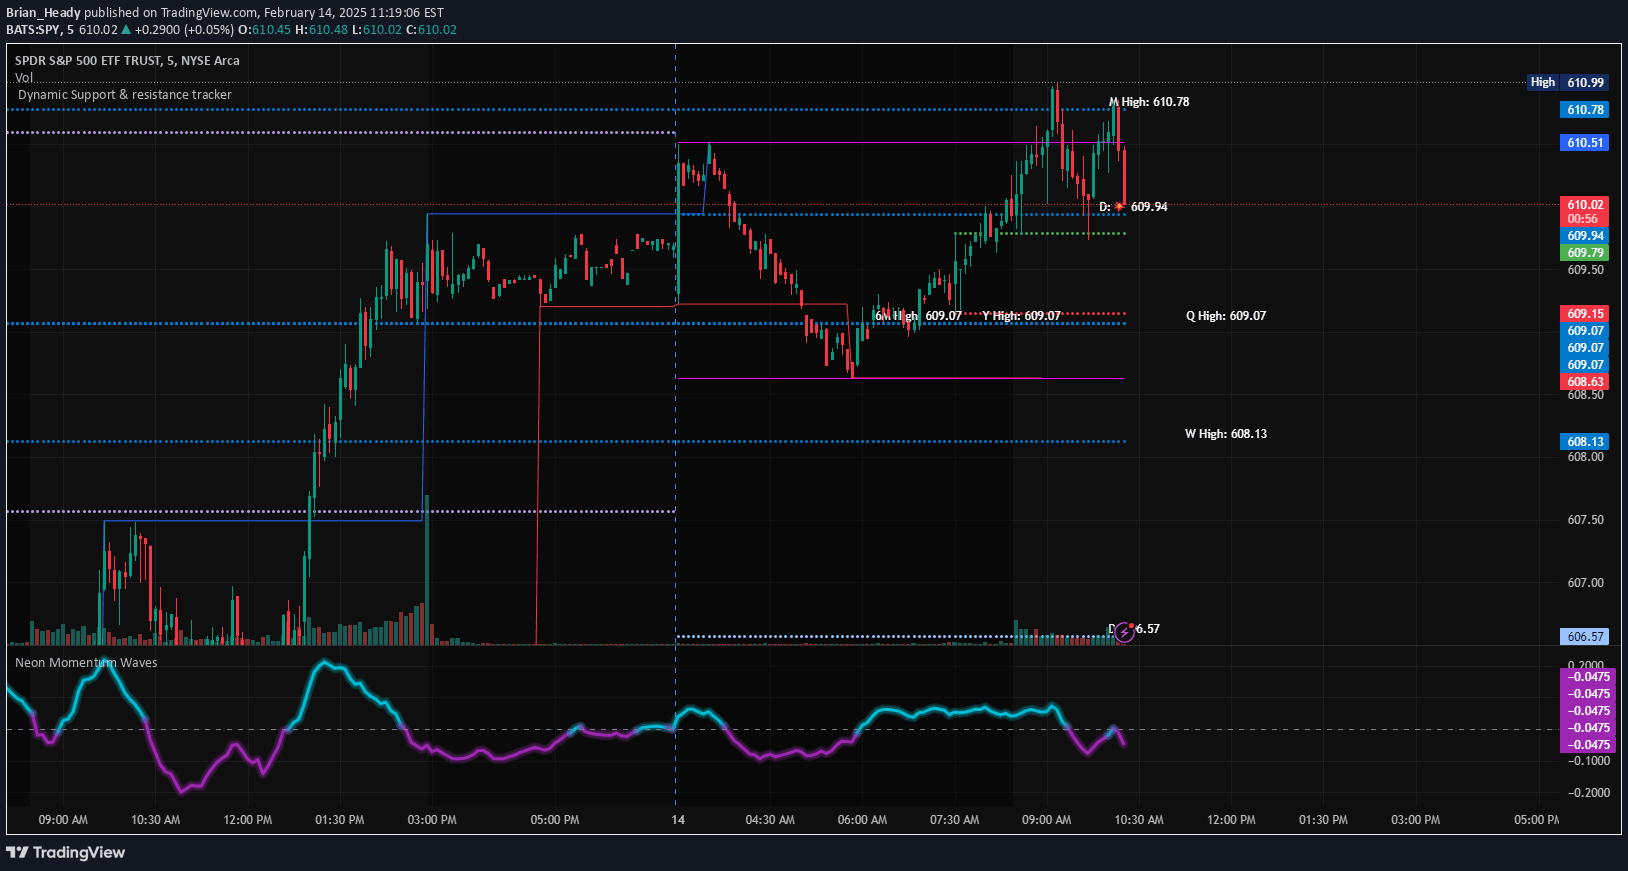
A dynamic trading tool that identifies and tracks support and resistance levels using pivot points, helping traders visualize key market price zones and potential breakout opportunities.
Explore complementary indicator rolesHow it works
The Dynamic Support & Resistance Tracker analyzes price action by calculating pivot points using a specified number of left and right bars. It generates support and resistance lines based on these pivot points, with resistance levels marked in red and support levels in blue.
The script dynamically updates these levels in real-time, adjusting to new market conditions. It also calculates additional reference points like daily and weekly high/low lines, midline, and extension lines to provide a comprehensive view of potential price ranges and breakout zones.
Why it may be useful
This tool provides traders with a systematic approach to identifying key price levels that can act as potential turning points or breakthrough zones in the market. By visualizing support and resistance dynamically, traders can make more informed decisions about entry, exit, and risk management strategies.
The comprehensive approach of tracking multiple timeframes and providing real-time updates helps traders stay ahead of market movements. It transforms complex price action analysis into clear, actionable visual information that can be quickly interpreted across different trading styles and market conditions.
When to explore it
The Dynamic Support & Resistance Tracker is most effective in markets with clear directional movements and defined price ranges. It works particularly well in liquid markets like forex, major stock indices, and actively traded commodities where price tends to respect key technical levels.
Traders should use this tool when seeking to confirm trend strength, identify potential breakout or reversal points, and develop more precise entry and exit strategies. It is especially valuable during periods of market consolidation or when transitioning between trending and ranging market conditions.
Keep exploring
What we’ve verified
Access, alerts and repainting behaviour have not been independently verified for this indicator. Check the creator’s current publication and settings.
General descriptions and classifications are recovered research. Verified details above identify the specific checks we have completed. Check the creator’s current publication for later changes.




