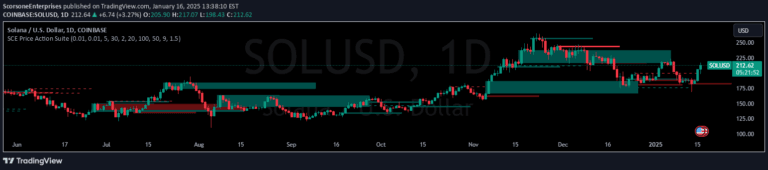
A comprehensive trading strategy combining inside bar detection, EMA crossovers, Bollinger Bands, and VWAP to identify market trends and potential entry/exit points.
Explore complementary indicator rolesHow it works
The signal begins by identifying inside bar patterns, which are candles contained within the previous candle's range, providing potential setup opportunities. It then calculates three exponential moving averages (9, 21, and 50 periods) to establish market trend direction and momentum.
The strategy integrates Bollinger Bands and Volume Weighted Average Price (VWAP) to further refine trade signals. Buy and sell conditions are triggered through specific crossover events, such as VWAP crossing the 9 EMA and price interacting with Bollinger Band boundaries, creating a multi-layered approach to market analysis.
Why it may be useful
This trading signal provides traders with a comprehensive and nuanced approach to market analysis by combining multiple technical indicators. It helps identify potential trend changes, volatility shifts, and entry/exit points through a sophisticated crossover and band interaction mechanism.
By integrating different analytical tools like EMAs, Bollinger Bands, and VWAP, the signal reduces the likelihood of false signals and provides a more robust trading strategy. Traders gain insights into market momentum, trend direction, and potential price reversals through a multi-dimensional technical analysis approach.
When to explore it
The signal is most effective in markets with clear trending characteristics and moderate volatility, where price movements are consistent enough to generate reliable crossover signals. It works particularly well in liquid markets with sufficient trading volume to support VWAP and EMA calculations.
Traders should apply this strategy during periods of stable market conditions, avoiding extremely choppy or range-bound markets. It is especially useful for identifying potential trend continuation or reversal opportunities across different timeframes, from scalping to swing trading.
Keep exploring
What we’ve verified
Access, alerts and repainting behaviour have not been independently verified for this indicator. Check the creator’s current publication and settings.
General descriptions and classifications are recovered research. Verified details above identify the specific checks we have completed. Check the creator’s current publication for later changes.