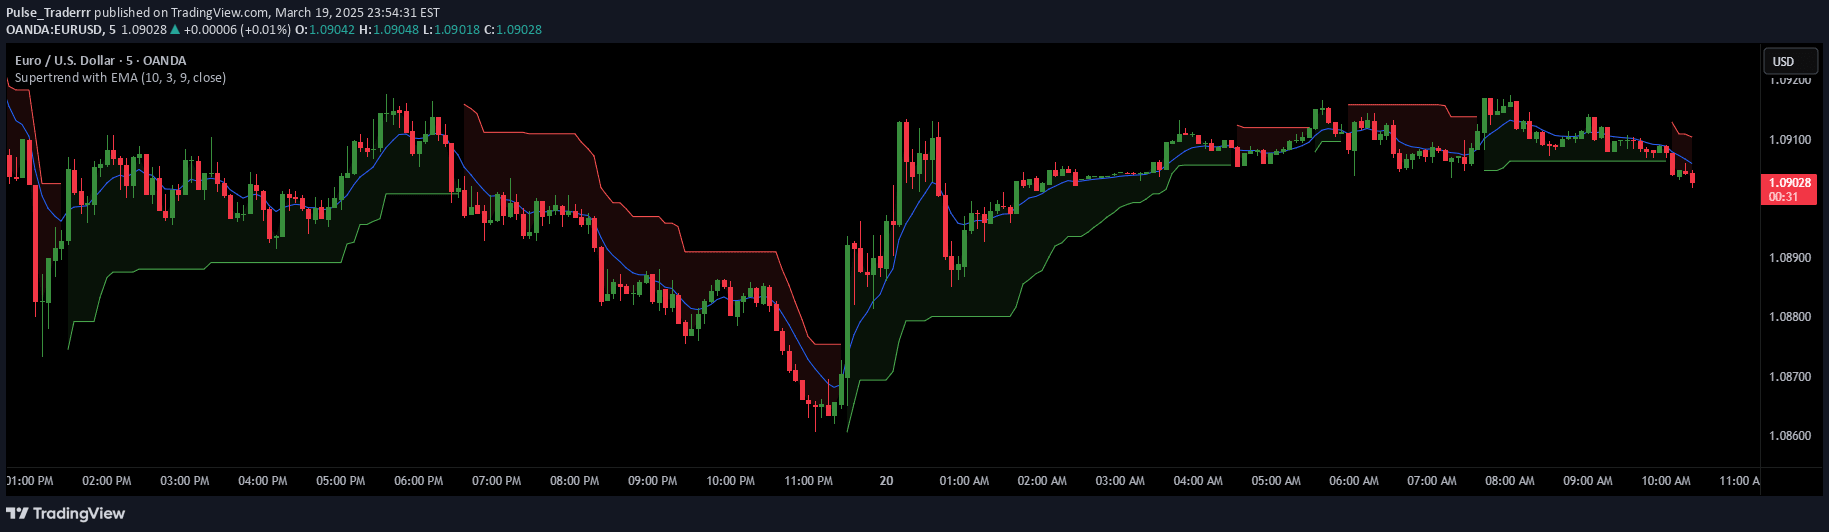
An EMA 9/21 crossover indicator that uses Average True Range (ATR) to calculate potential price targets based on EMA crossovers and market sentiment.
Explore complementary indicator rolesHow it works
The indicator analyzes the 9 and 21 Exponential Moving Averages (EMAs) to identify potential trend changes and trading opportunities. When the shorter EMA (9) crosses above or below the longer EMA (21), it generates a signal indicating a potential trend shift, with specific price targets calculated using Average True Range (ATR).
The system tracks consecutive closes above or below the EMA crossover points to confirm the signal's strength. It then calculates potential take-profit levels based on historical price movement ranges, providing traders with precise entry and exit points for different market conditions.
Why it may be useful
This indicator helps traders quickly identify potential trend changes and set realistic price targets based on recent market volatility. By combining EMA crossovers with ATR-based analysis, it provides a more nuanced approach to trend identification and potential price movement.
The signal offers traders a systematic method to assess market momentum and potential entry or exit points, reducing emotional decision-making and providing a structured approach to trading different financial instruments across various timeframes.
When to explore it
The indicator works best on shorter timeframes, particularly 5-minute and 15-minute charts for day trading and scalping. It is most effective on liquid stocks and ETFs like SPY, QQQ, TSLA, and NVDA, where price movements are more predictable and volume is consistent.
Traders should use this signal in conjunction with other technical and fundamental analysis, as it is not a standalone trading strategy. It is particularly useful during periods of clear market trends and when seeking to capture short-term price movements with defined risk and potential reward.
Keep exploring
What we’ve verified
Access, alerts and repainting behaviour have not been independently verified for this indicator. Check the creator’s current publication and settings.
General descriptions and classifications are recovered research. Verified details above identify the specific checks we have completed. Check the creator’s current publication for later changes.