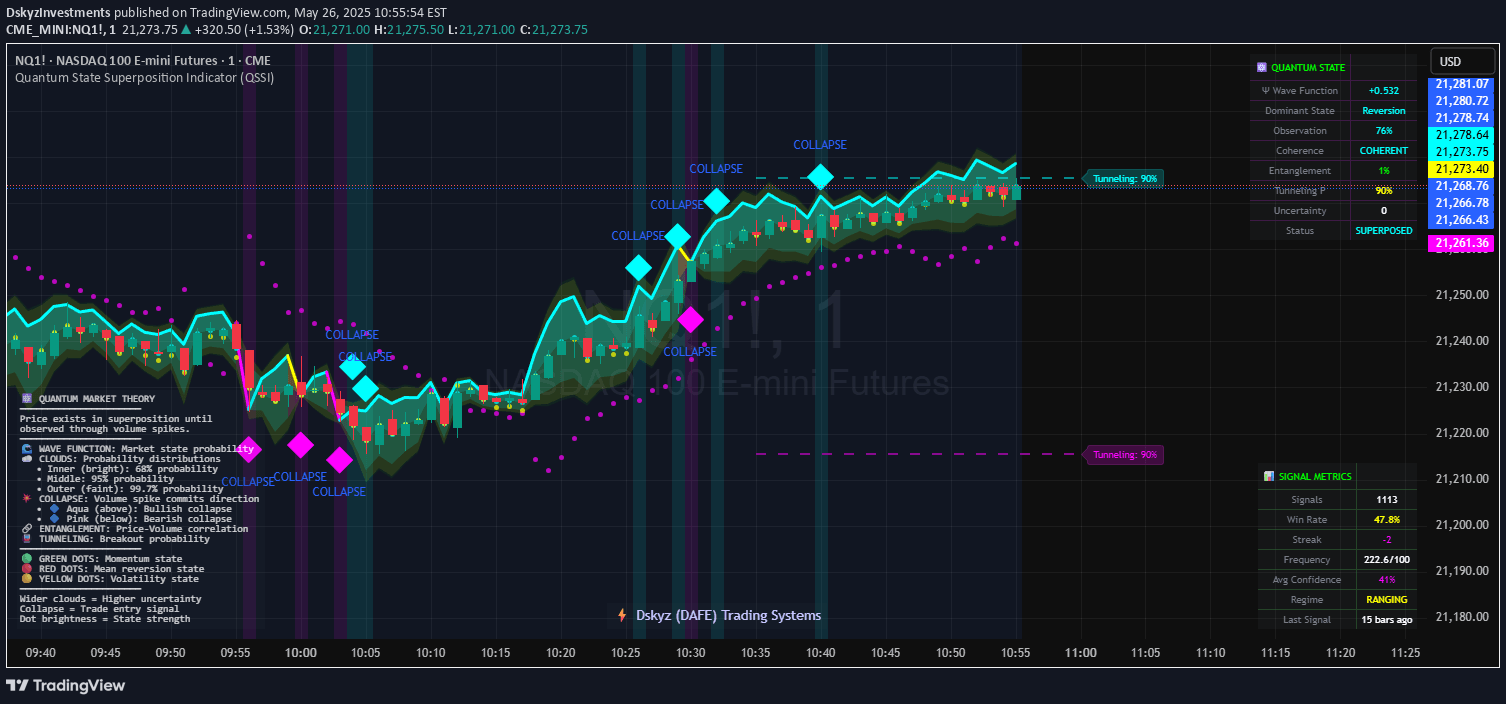
A technical analysis tool combining EMA 10 and ATR to assess short-term price trends and market volatility, providing buy and sell signals based on price movement relative to the EMA.
Explore complementary indicator rolesHow it works
The EMA 10 and ATR Indicator operates by first calculating a 10-period exponential moving average that dynamically tracks recent price changes. This EMA line serves as a key reference point for identifying the current trend direction, with price positioning above or below the line indicating bullish or bearish momentum.
Simultaneously, the Average True Range measures market volatility by assessing price range fluctuations. When the ATR falls between 10 and 14, it signals significant price movement, helping traders validate potential trading opportunities based on both trend direction and market volatility.
Why it may be useful
This indicator provides traders with a comprehensive view of market dynamics by combining trend identification and volatility assessment in a single tool. The EMA helps smooth out price fluctuations, offering a clearer perspective on short-term trend direction, while the ATR helps traders understand the strength and potential of price movements.
By integrating these two powerful technical indicators, traders can make more informed decisions, reducing the risk of trading in uncertain market conditions. The visual representations, such as color-coded backgrounds and price status circles, further enhance the indicator's user-friendliness and interpretability.
When to explore it
The EMA 10 and ATR Indicator is most effective in markets with clear short-term trends and moderate volatility. It works particularly well in liquid markets like forex, stocks, and cryptocurrency, where price movements are more predictable and rapid. Traders should prioritize using this indicator in timeframes ranging from minutes to hours.
While powerful, this indicator should not be used in isolation. Traders are recommended to complement it with additional technical analysis tools, fundamental research, and risk management strategies to validate signals and minimize potential trading risks.
Keep exploring
What we’ve verified
Access, alerts and repainting behaviour have not been independently verified for this indicator. Check the creator’s current publication and settings.
General descriptions and classifications are recovered research. Verified details above identify the specific checks we have completed. Check the creator’s current publication for later changes.