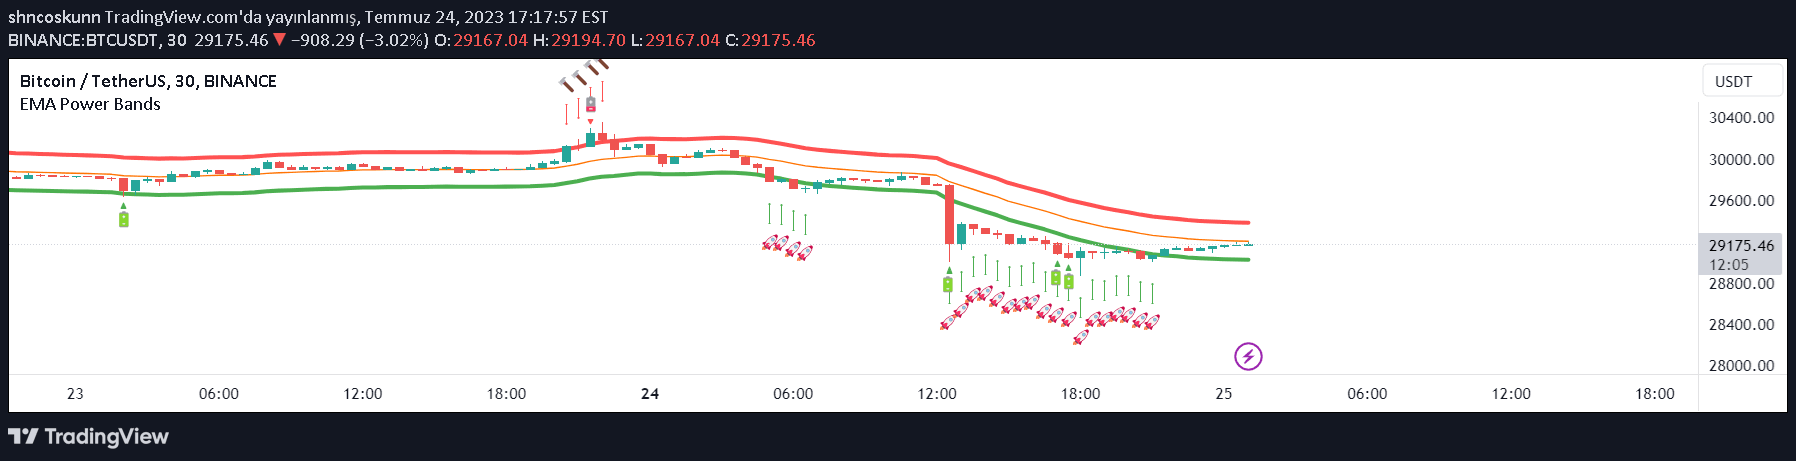
An advanced EMA-based indicator that detects price crossovers, analyzes trend direction, and provides visual insights into market movement and potential trading opportunities.
Explore complementary indicator rolesHow it works
The EMA Cross Counter operates by tracking price movements in relation to the 200-period Exponential Moving Average (EMA), identifying precise crossover moments. It dynamically analyzes price interactions by categorizing signals as valid or invalid based on subsequent price action and trend sustainability.
The indicator uses color-coding to represent market conditions: green for bullish trends, red for bearish trends, and gray for ranging markets. It automatically calculates crossover statistics, displays stop-loss levels, and provides visual cues about potential trading opportunities by highlighting significant price movements.
Why it may be useful
The EMA Cross Counter offers traders a comprehensive view of market dynamics by transforming complex price interactions into clear, actionable visual signals. By providing immediate insights into trend direction and crossover reliability, traders can make more informed decisions with reduced emotional bias.
Its unique feature of displaying success rate statistics helps traders understand the probability of successful trades, enabling more strategic entry and exit points. The indicator's adaptive color-coding and range detection mechanism provide an intuitive way to quickly assess market conditions without extensive manual analysis.
When to explore it
The EMA Cross Counter is most effective in markets with clear trending characteristics, particularly during periods of sustained directional movement in major currency pairs or liquid financial instruments. Traders should prioritize using this indicator during times of higher market volatility and when price shows consistent directional momentum.
It is particularly valuable for traders seeking to confirm trend changes, identify potential entry and exit points, and manage risk through its built-in stop-loss visualization. The indicator performs best when combined with additional confirmation tools and used across multiple timeframes to validate signals.
Keep exploring
What we’ve verified
Access, alerts and repainting behaviour have not been independently verified for this indicator. Check the creator’s current publication and settings.
General descriptions and classifications are recovered research. Verified details above identify the specific checks we have completed. Check the creator’s current publication for later changes.