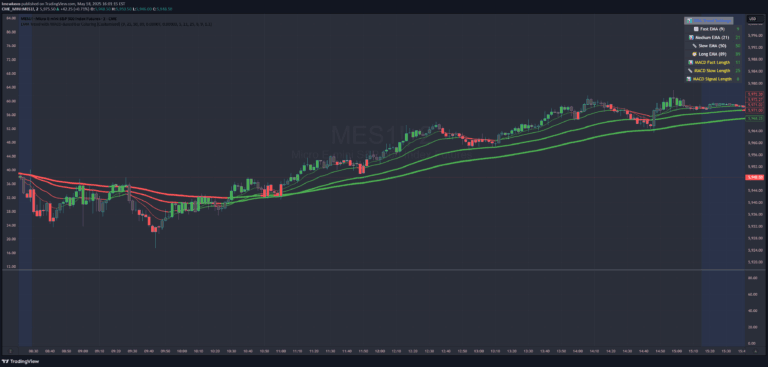
An EMA Ribbon indicator that visualizes market trends through a dynamic color-changing overlay, helping traders quickly identify trend shifts and potential entry/exit points.
Explore complementary indicator rolesHow it works
The EMA Ribbon calculates eight exponential moving averages with lengths ranging from 21 to 55 periods, creating a layered visual representation of price momentum. Each EMA is plotted on the chart, with the positioning of these moving averages determining the current market trend.
When shorter EMAs are positioned above longer EMAs, it indicates a bullish trend, while the reverse suggests a bearish trend. The indicator dynamically tracks these EMA positions, providing a clear visual interpretation of market direction through color-coded transitions between red and green.
Why it may be useful
The EMA Ribbon provides traders with a comprehensive view of market momentum by displaying multiple moving averages simultaneously. This multi-layered approach offers deeper insights into trend strength and potential reversals, allowing traders to make more informed decisions based on comprehensive trend analysis.
By transforming complex trend data into an intuitive visual format, the indicator reduces the cognitive load of interpreting multiple technical signals. The color-coded system makes it easy to quickly understand market sentiment and potential trend shifts, enhancing a trader's ability to react swiftly to changing market conditions.
When to explore it
The EMA Ribbon is most effective in trending markets with clear directional movements, particularly in stocks, forex, and cryptocurrency trading. It works best when price is experiencing sustained momentum in either bullish or bearish directions, providing clear signals during strong market trends.
Traders should combine this indicator with other technical analysis tools to confirm signals and reduce false positives. It is particularly useful for trend-following strategies and can help traders identify potential entry and exit points during significant market movements.
Keep exploring
What we’ve verified
Access, alerts and repainting behaviour have not been independently verified for this indicator. Check the creator’s current publication and settings.
General descriptions and classifications are recovered research. Verified details above identify the specific checks we have completed. Check the creator’s current publication for later changes.