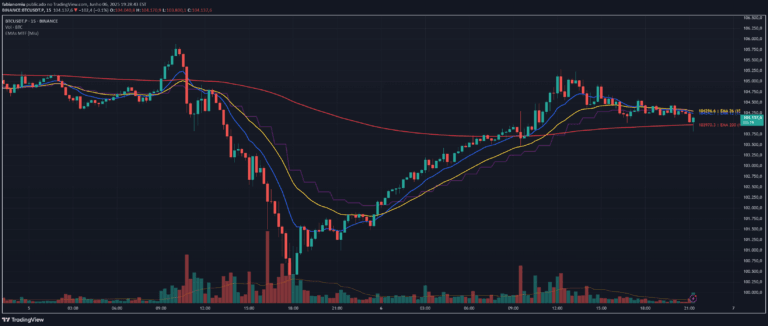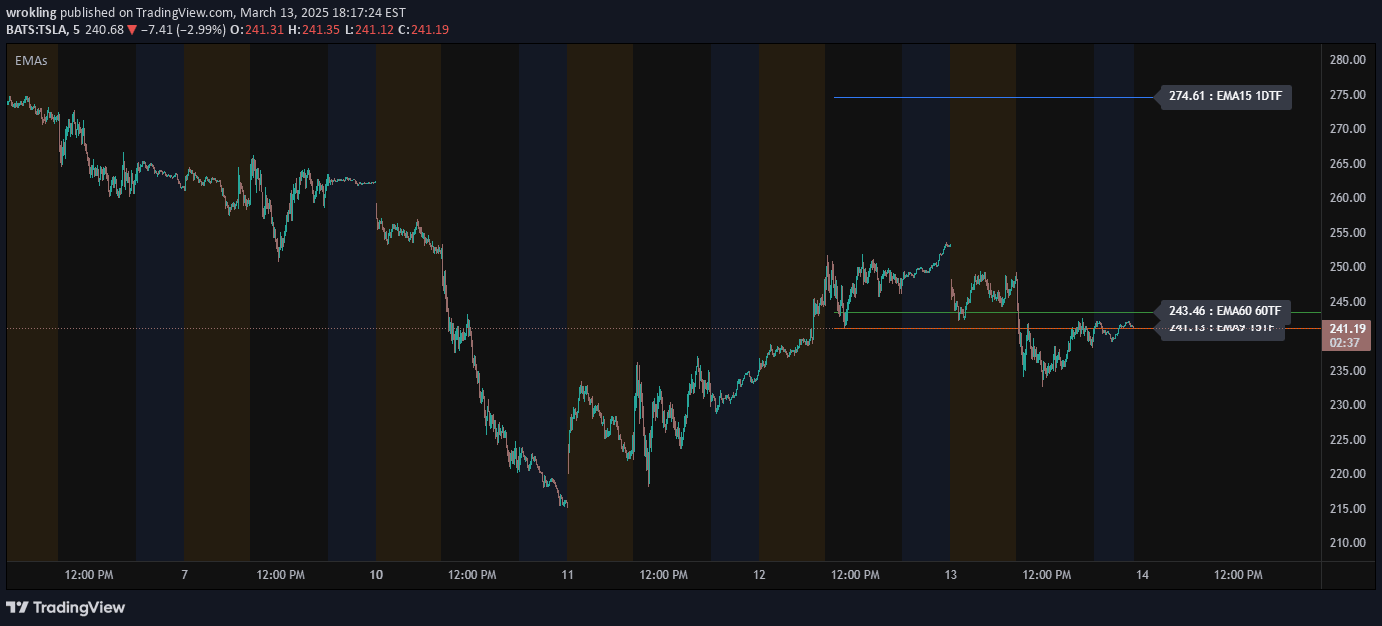
A chart indicator displaying up to 5 Exponential Moving Averages simultaneously, providing a visual representation of price trends across different timeframes.
Explore complementary indicator rolesHow it works
Exponential Moving Averages (EMAs) calculate average price over specific periods, giving more weight to recent price data compared to traditional simple moving averages. The indicator plots multiple EMAs on a single chart, allowing traders to observe price trends across different time intervals simultaneously.
Each EMA line represents the average price for its specific timeframe, with shorter period EMAs being more responsive to recent price changes and longer period EMAs showing more stable, overarching trend directions. Traders can customize the number of EMAs and their respective periods to suit their specific trading strategy and market analysis needs.
Why it may be useful
EMAs help traders identify trend direction, momentum, and potential trend reversals by smoothing out price fluctuations and highlighting market sentiment. They provide a visual representation of price movement that can help traders make more informed decisions about entry and exit points.
By displaying multiple EMAs simultaneously, traders can gain a more comprehensive view of market trends across different timeframes. This multi-timeframe approach allows for a more nuanced understanding of price dynamics, helping traders recognize potential trend changes and make more strategic trading decisions.
When to explore it
Multiple EMA indicators work best in trending markets where price moves consistently in a particular direction, either upward or downward. They are particularly useful for traders seeking to understand overall market momentum and identify potential trend continuation or reversal points.
Traders should use this indicator in conjunction with other technical analysis tools to confirm signals and reduce the risk of false interpretations. It is most effective on higher timeframes and can be particularly valuable for day and swing traders looking to capture medium to long-term price movements.
Keep exploring
What we’ve verified
Access, alerts and repainting behaviour have not been independently verified for this indicator. Check the creator’s current publication and settings.
General descriptions and classifications are recovered research. Verified details above identify the specific checks we have completed. Check the creator’s current publication for later changes.