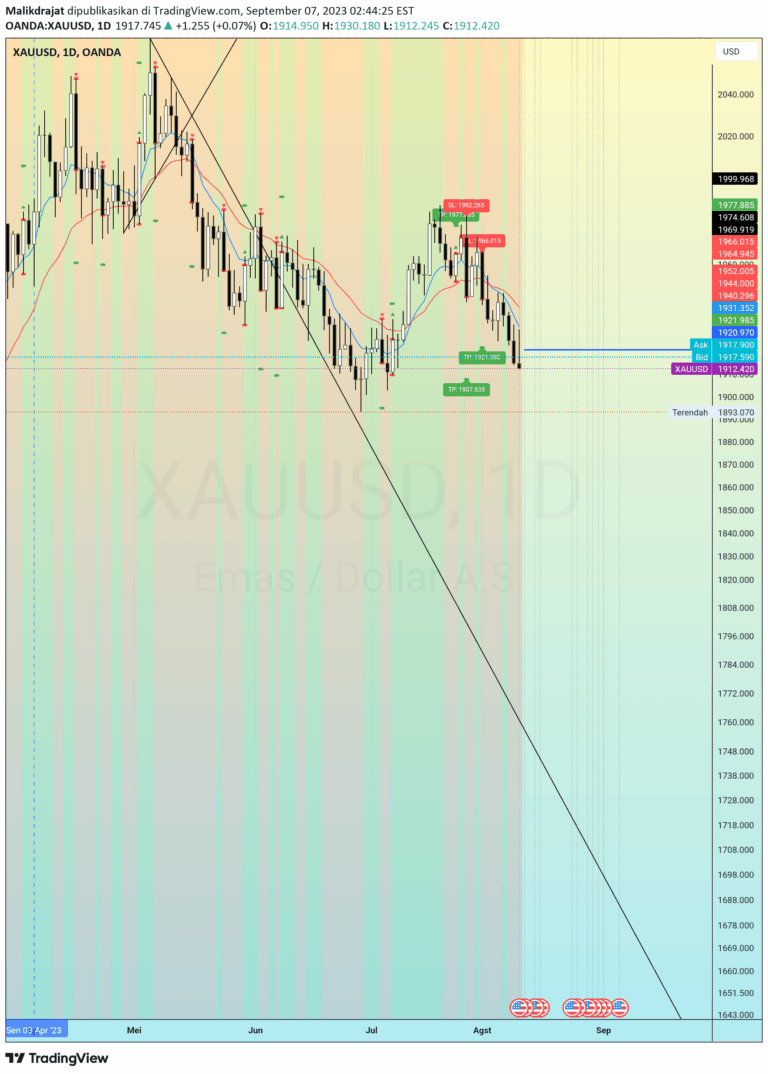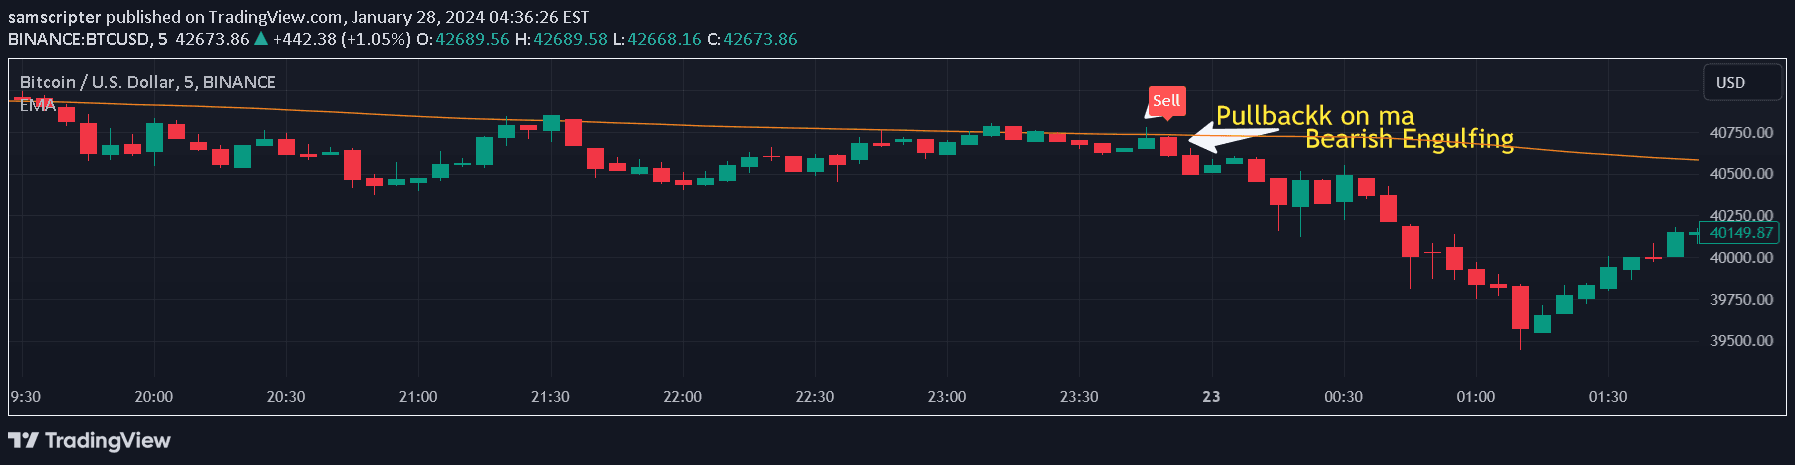
A trading strategy identifying price pullbacks on moving averages combined with engulfing candlestick patterns to generate potential buy and sell signals for trend reversals.
Explore complementary indicator rolesHow it works
The indicator monitors price movement relative to a moving average, specifically looking for pullback scenarios where price approaches and touches the moving average line. For a buy signal, the price must be above the moving average and then pull back to touch it, followed by a bullish engulfing candle pattern on the subsequent trading period.
Conversely, for a sell signal, the price must be below the moving average and pull back to touch it, with a bearish engulfing candle pattern forming on the next trading period. This method combines trend analysis with candlestick pattern recognition to identify potential trend reversal points.
Why it may be useful
This trading signal provides traders with a structured approach to identifying potential trend reversals by combining multiple technical analysis elements. By integrating moving average dynamics with candlestick pattern recognition, traders can gain more confidence in their entry and exit decisions.
The strategy offers a systematic method for detecting potential market turning points, helping traders manage risk and improve timing of their trades. It bridges the gap between trend analysis and price action, providing a more comprehensive view of market movements.
When to explore it
The signal works best in trending markets with clear directional movements, where moving averages can effectively represent the underlying market trend. It is particularly useful in markets with moderate volatility, where clear pullback and engulfing patterns can be easily identified.
Traders should consider using this strategy in markets with sufficient liquidity and during trading sessions with active price movements. It is most effective when applied to timeframes that allow for clear pattern formation, such as daily or hourly charts.
Keep exploring
What we’ve verified
Access, alerts and repainting behaviour have not been independently verified for this indicator. Check the creator’s current publication and settings.
General descriptions and classifications are recovered research. Verified details above identify the specific checks we have completed. Check the creator’s current publication for later changes.