
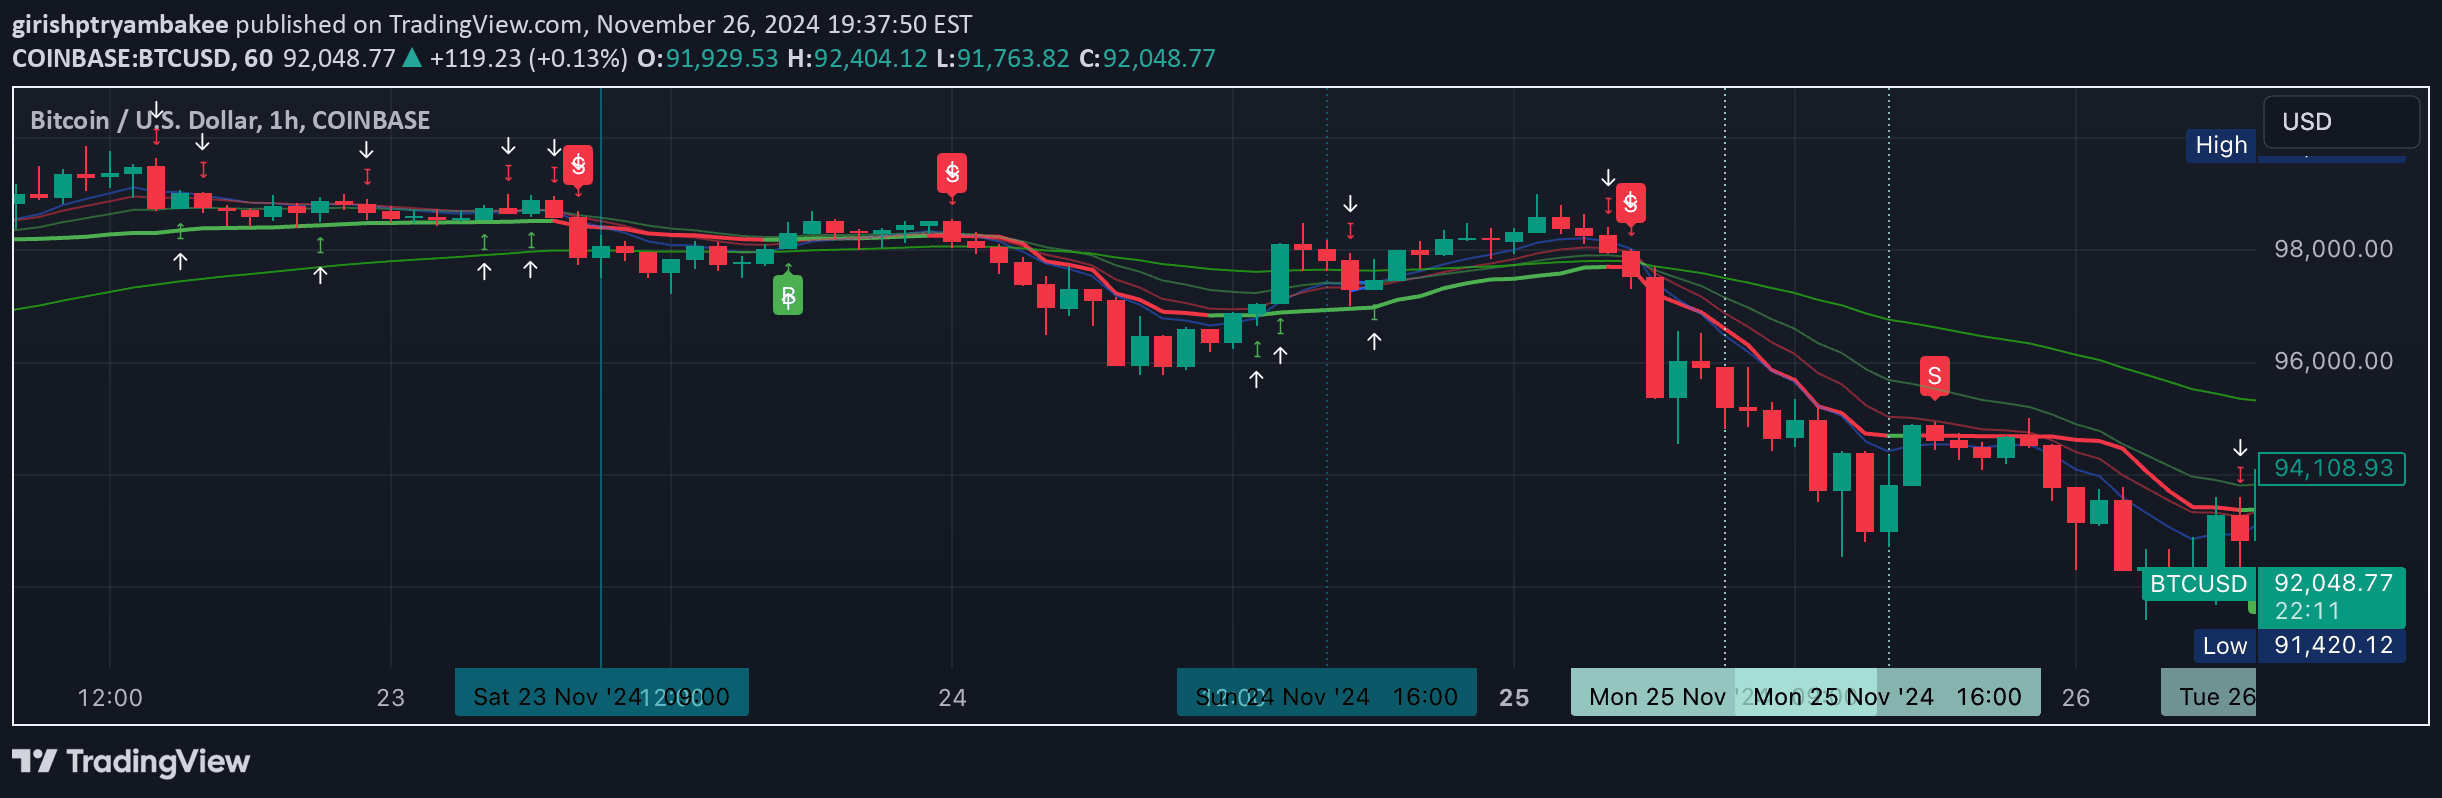
An advanced trading indicator combining Kaufman Adaptive Moving Average with Bollinger Bands to provide dynamic trend analysis, volatility measurement, and adaptive trading signals.
Explore complementary indicator rolesHow it works
The Enhanced Kaufman Adaptive Moving Average (KAMA) with Bollinger Bands operates by dynamically tracking price movements and market volatility. It calculates an adaptive moving average that adjusts its sensitivity based on market efficiency, using an efficiency ratio that responds quickly to significant price changes.
The system simultaneously plots Bollinger Bands around a central moving average, measuring price volatility through standard deviation bands. By integrating these two components, the indicator generates color-coded trend signals and identifies potential entry and exit points based on multiple confirming conditions.
Why it may be useful
This indicator provides traders with a sophisticated tool for understanding market dynamics by combining trend detection and volatility measurement in a single system. Its adaptive nature allows it to respond more accurately to changing market conditions compared to traditional static moving averages.
By offering color-coded trend indications, customizable parameters, and integrated buy/sell signals, the indicator helps traders make more informed decisions. The combination of KAMA and Bollinger Bands offers a comprehensive view of market movement, helping traders identify potential trend reversals and maintain trading discipline.
When to explore it
The Enhanced KAMA with Bollinger Bands is most effective in markets with moderate to high volatility, particularly on timeframes ranging from 15-minute to 4-hour charts. It performs exceptionally well in trending markets where price shows clear directional movement and distinct volatility shifts.
Traders should consider using this indicator when seeking a dynamic, adaptive approach to trend analysis that goes beyond traditional moving average systems. It is particularly useful for traders who want a flexible tool that can adjust to different market conditions and provide nuanced insights into potential trading opportunities.
Keep exploring
What we’ve verified
Access, alerts and repainting behaviour have not been independently verified for this indicator. Check the creator’s current publication and settings.
General descriptions and classifications are recovered research. Verified details above identify the specific checks we have completed. Check the creator’s current publication for later changes.


