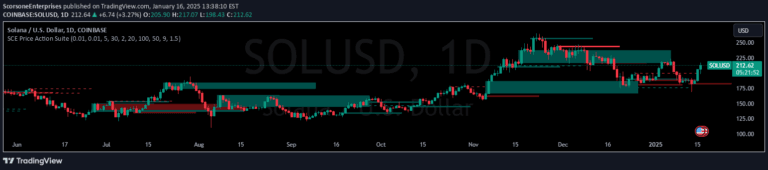
A versatile technical analysis tool that uses kernel selection and envelope bands to identify market trends and provide clear trade signals through plotshape markers and background color changes.
Explore complementary indicator rolesHow it works
The Envelope with Kernel Selection [CHE] indicator operates by creating dynamic trend bands around a midline using six different kernel functions for price smoothing. These kernel functions include Linear, Exponential, Epanechnikov, Triangular, Cosine, and Gauss, allowing traders to customize the smoothing process based on market conditions.
The indicator generates signals through two primary mechanisms: plotshape markers and background color changes. When price crosses the upper or lower bands, visual arrows appear to indicate potential buy or sell opportunities. Additionally, the background color dynamically shifts between green (bullish) and red (bearish) to provide an immediate visual representation of the current market trend.
Why it may be useful
This indicator is crucial for traders seeking a comprehensive and adaptable market analysis tool that combines multiple signal generation methods. By offering both plotshape markers and background color indicators, it provides traders with multiple layers of trend and momentum information, enhancing decision-making capabilities.
The non-repainting nature of the signals ensures reliability and consistency, which is essential for developing robust trading strategies. Traders can customize the kernel selection to match their specific analysis style, making the indicator versatile across different market conditions and trading approaches.
When to explore it
The Envelope with Kernel Selection [CHE] is most effective in markets with clear trending characteristics, where price movement shows consistent directional momentum. It performs exceptionally well in identifying potential entry and exit points during both bullish and bearish market phases, making it suitable for various trading styles and timeframes.
Traders should utilize this indicator when seeking a flexible tool that can adapt to different market volatilities and provide clear, visual trend signals. It is particularly useful for those who prefer a combination of technical analysis methods and want an intuitive, customizable approach to trend identification and trade signal generation.
Keep exploring
What we’ve verified
Access, alerts and repainting behaviour have not been independently verified for this indicator. Check the creator’s current publication and settings.
General descriptions and classifications are recovered research. Verified details above identify the specific checks we have completed. Check the creator’s current publication for later changes.