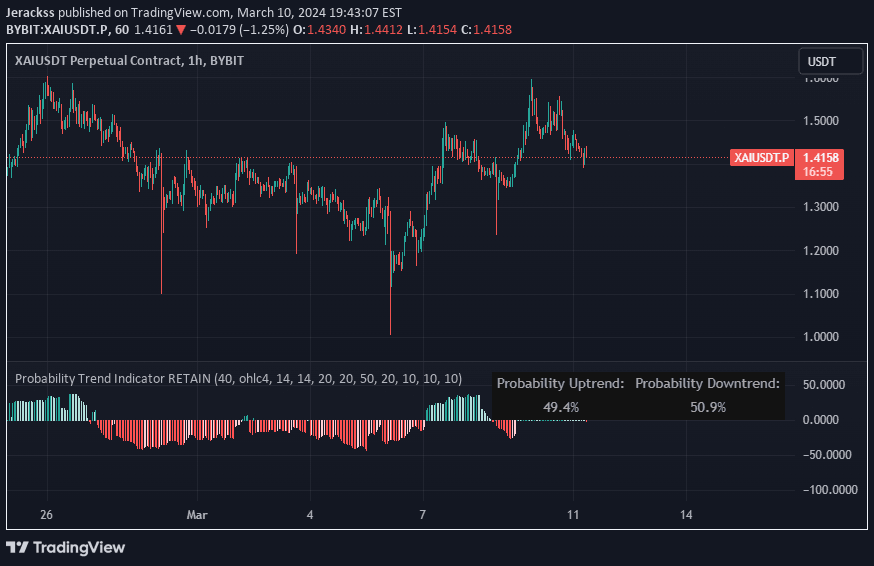
A technical analysis tool that calculates Vortex Indicators to identify market trends by analyzing price movements through positive and negative trend lines.
Explore complementary indicator rolesHow it works
The Vortex Indicator Pro calculates two main lines: a smoothed positive trend indicator (VI+) and a smoothed negative trend indicator (VI-). These lines are derived from price movements, tracking the directional momentum of the market by comparing upward and downward price changes.
When the smoothed VI+ lines cross each other or interact with the Smoothed VI- line, they generate potential trend signals. The positioning and crossing of these lines help traders understand whether the market is trending bullish or bearish, providing visual cues about potential trend reversals or continuations.
Why it may be useful
The Vortex Indicator Pro offers traders a sophisticated method to understand market trends beyond simple price action. By providing nuanced insights into directional movement, it helps traders make more informed decisions about potential trend changes and market momentum.
Unlike many traditional indicators, this tool combines multiple trend perspectives, allowing traders to see subtle shifts in market sentiment. Its ability to generate signals through line crossovers and relative positioning makes it a valuable tool for identifying potential entry and exit points in various market conditions.
When to explore it
The Vortex Indicator Pro is most effective in markets with clear trending characteristics, such as forex, stocks, and commodities. It performs best when markets are experiencing directional movement, helping traders identify and confirm emerging trends with greater accuracy.
Traders should use this indicator in conjunction with other technical analysis tools to validate signals and reduce false positives. It is particularly useful during periods of market transition, when trend direction is uncertain and traders need additional confirmation of potential market shifts.
Keep exploring
What we’ve verified
Access, alerts and repainting behaviour have not been independently verified for this indicator. Check the creator’s current publication and settings.
General descriptions and classifications are recovered research. Verified details above identify the specific checks we have completed. Check the creator’s current publication for later changes.