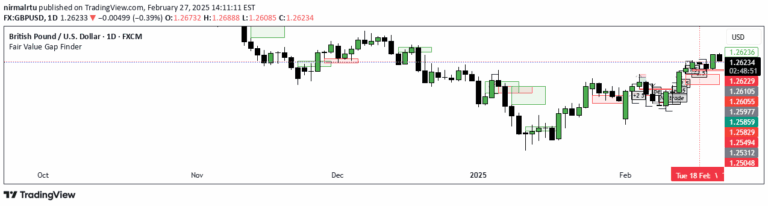
Advanced Fair Value Gap detector identifying market inefficiencies through dynamic support/resistance lines, helping traders spot potential trading opportunities across different market conditions.
Explore complementary indicator rolesHow it works
The Fair Value Gap (FVG) indicator automatically scans price charts to detect imbalance zones between consecutive candlesticks, marking these areas with color-coded boxes. It identifies bullish and bearish gaps by analyzing the price structure, creating visual representations of market inefficiencies where price has moved quickly without typical consolidation.
The tool extends dotted lines for active reference levels and tracks gap fills in real-time, providing traders with dynamic visual cues about potential support and resistance zones. By filtering gaps based on size and significance, the indicator helps traders focus on the most meaningful price inefficiencies in the market.
Why it may be useful
Fair Value Gap analysis provides traders with a unique perspective on market dynamics by highlighting areas of price imbalance and potential market inefficiencies. These gaps represent moments where the market has moved rapidly, creating zones of potential future price interaction that can be crucial for understanding market structure and potential reversal or continuation points.
By visualizing these gaps, traders gain insights into market psychology, identifying areas where supply and demand were temporarily out of balance. This approach helps traders make more informed decisions about potential entry and exit points, offering a sophisticated method of analyzing price action beyond traditional technical analysis tools.
When to explore it
The Fair Value Gap indicator works best on higher timeframes (1-hour and above) where price inefficiencies are more significant and meaningful. Traders should focus on instances where multiple Fair Value Gaps cluster in a specific zone, as these areas indicate stronger potential support or resistance levels.
The indicator is particularly useful when combined with other technical analysis tools, helping to confirm potential trading setups and providing additional context to price action. Traders should pay close attention to how price reacts when approaching these identified gaps, using them as reference points for potential trend continuation or reversal strategies.
Keep exploring
What we’ve verified
Access, alerts and repainting behaviour have not been independently verified for this indicator. Check the creator’s current publication and settings.
General descriptions and classifications are recovered research. Verified details above identify the specific checks we have completed. Check the creator’s current publication for later changes.