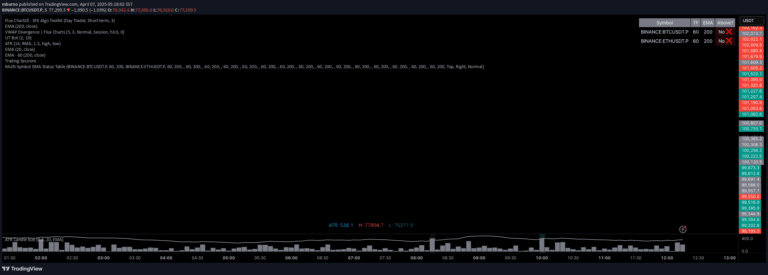
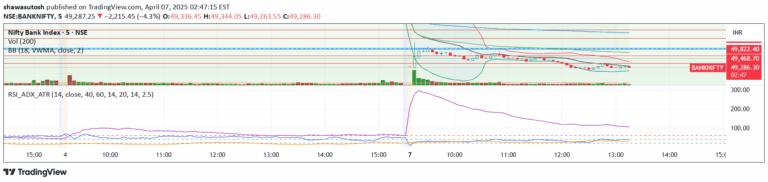
A sophisticated TradingView indicator using Fibonacci-based EMAs to provide dynamic market insights across multiple timeframes with customizable smoothing techniques.
Explore complementary indicator rolesHow it works
The Fibonacci Adaptive Timeframe EMA works by selecting EMA lengths based on the Fibonacci sequence, ranging from 1 to 987. It allows traders to choose from multiple smoothing methods like SMA, EMA, SMMA, WMA, and VWMA, providing flexibility in trend analysis. The indicator calculates moving averages dynamically, adapting to different timeframes and offering a comprehensive view of market trends.
By leveraging Fibonacci numbers, the indicator creates adaptive EMA lines that can be customized in terms of source data, length, and smoothing technique. Traders can visualize EMA lines, prices, and even project forecast lines into the future, giving them a nuanced understanding of potential price movements and trend continuations.
Why it may be useful
The Fibonacci Adaptive Timeframe EMA is crucial for traders seeking a sophisticated, mathematically-grounded approach to trend analysis. By incorporating Fibonacci sequence lengths, the indicator taps into natural market rhythms that many traders believe influence price movements. Its multi-timeframe analysis capability provides traders with a more comprehensive market perspective, allowing for more informed trading decisions.
The indicator's versatility in smoothing methods and customization options makes it a powerful tool for traders across different asset classes and trading styles. Its ability to adapt to various timeframes and provide dynamic visualizations helps traders identify trend strengths, potential reversals, and market dynamics with greater precision.
When to explore it
This indicator is most effective when traders want a flexible, mathematically-informed approach to trend analysis across different market conditions and asset classes. It works particularly well in markets with clear trending behavior, such as forex, stocks, commodities, and cryptocurrencies. The Fibonacci-based EMA can help traders identify trend continuation, potential reversal points, and market momentum across multiple timeframes.
Traders should use this indicator when they need a customizable tool that offers both detailed trend analysis and adaptable visualization options. It is especially useful for those who appreciate the significance of Fibonacci numbers in market analysis and want a comprehensive view of price dynamics that goes beyond traditional moving average techniques.
Keep exploring
What we’ve verified
Access, alerts and repainting behaviour have not been independently verified for this indicator. Check the creator’s current publication and settings.
General descriptions and classifications are recovered research. Verified details above identify the specific checks we have completed. Check the creator’s current publication for later changes.