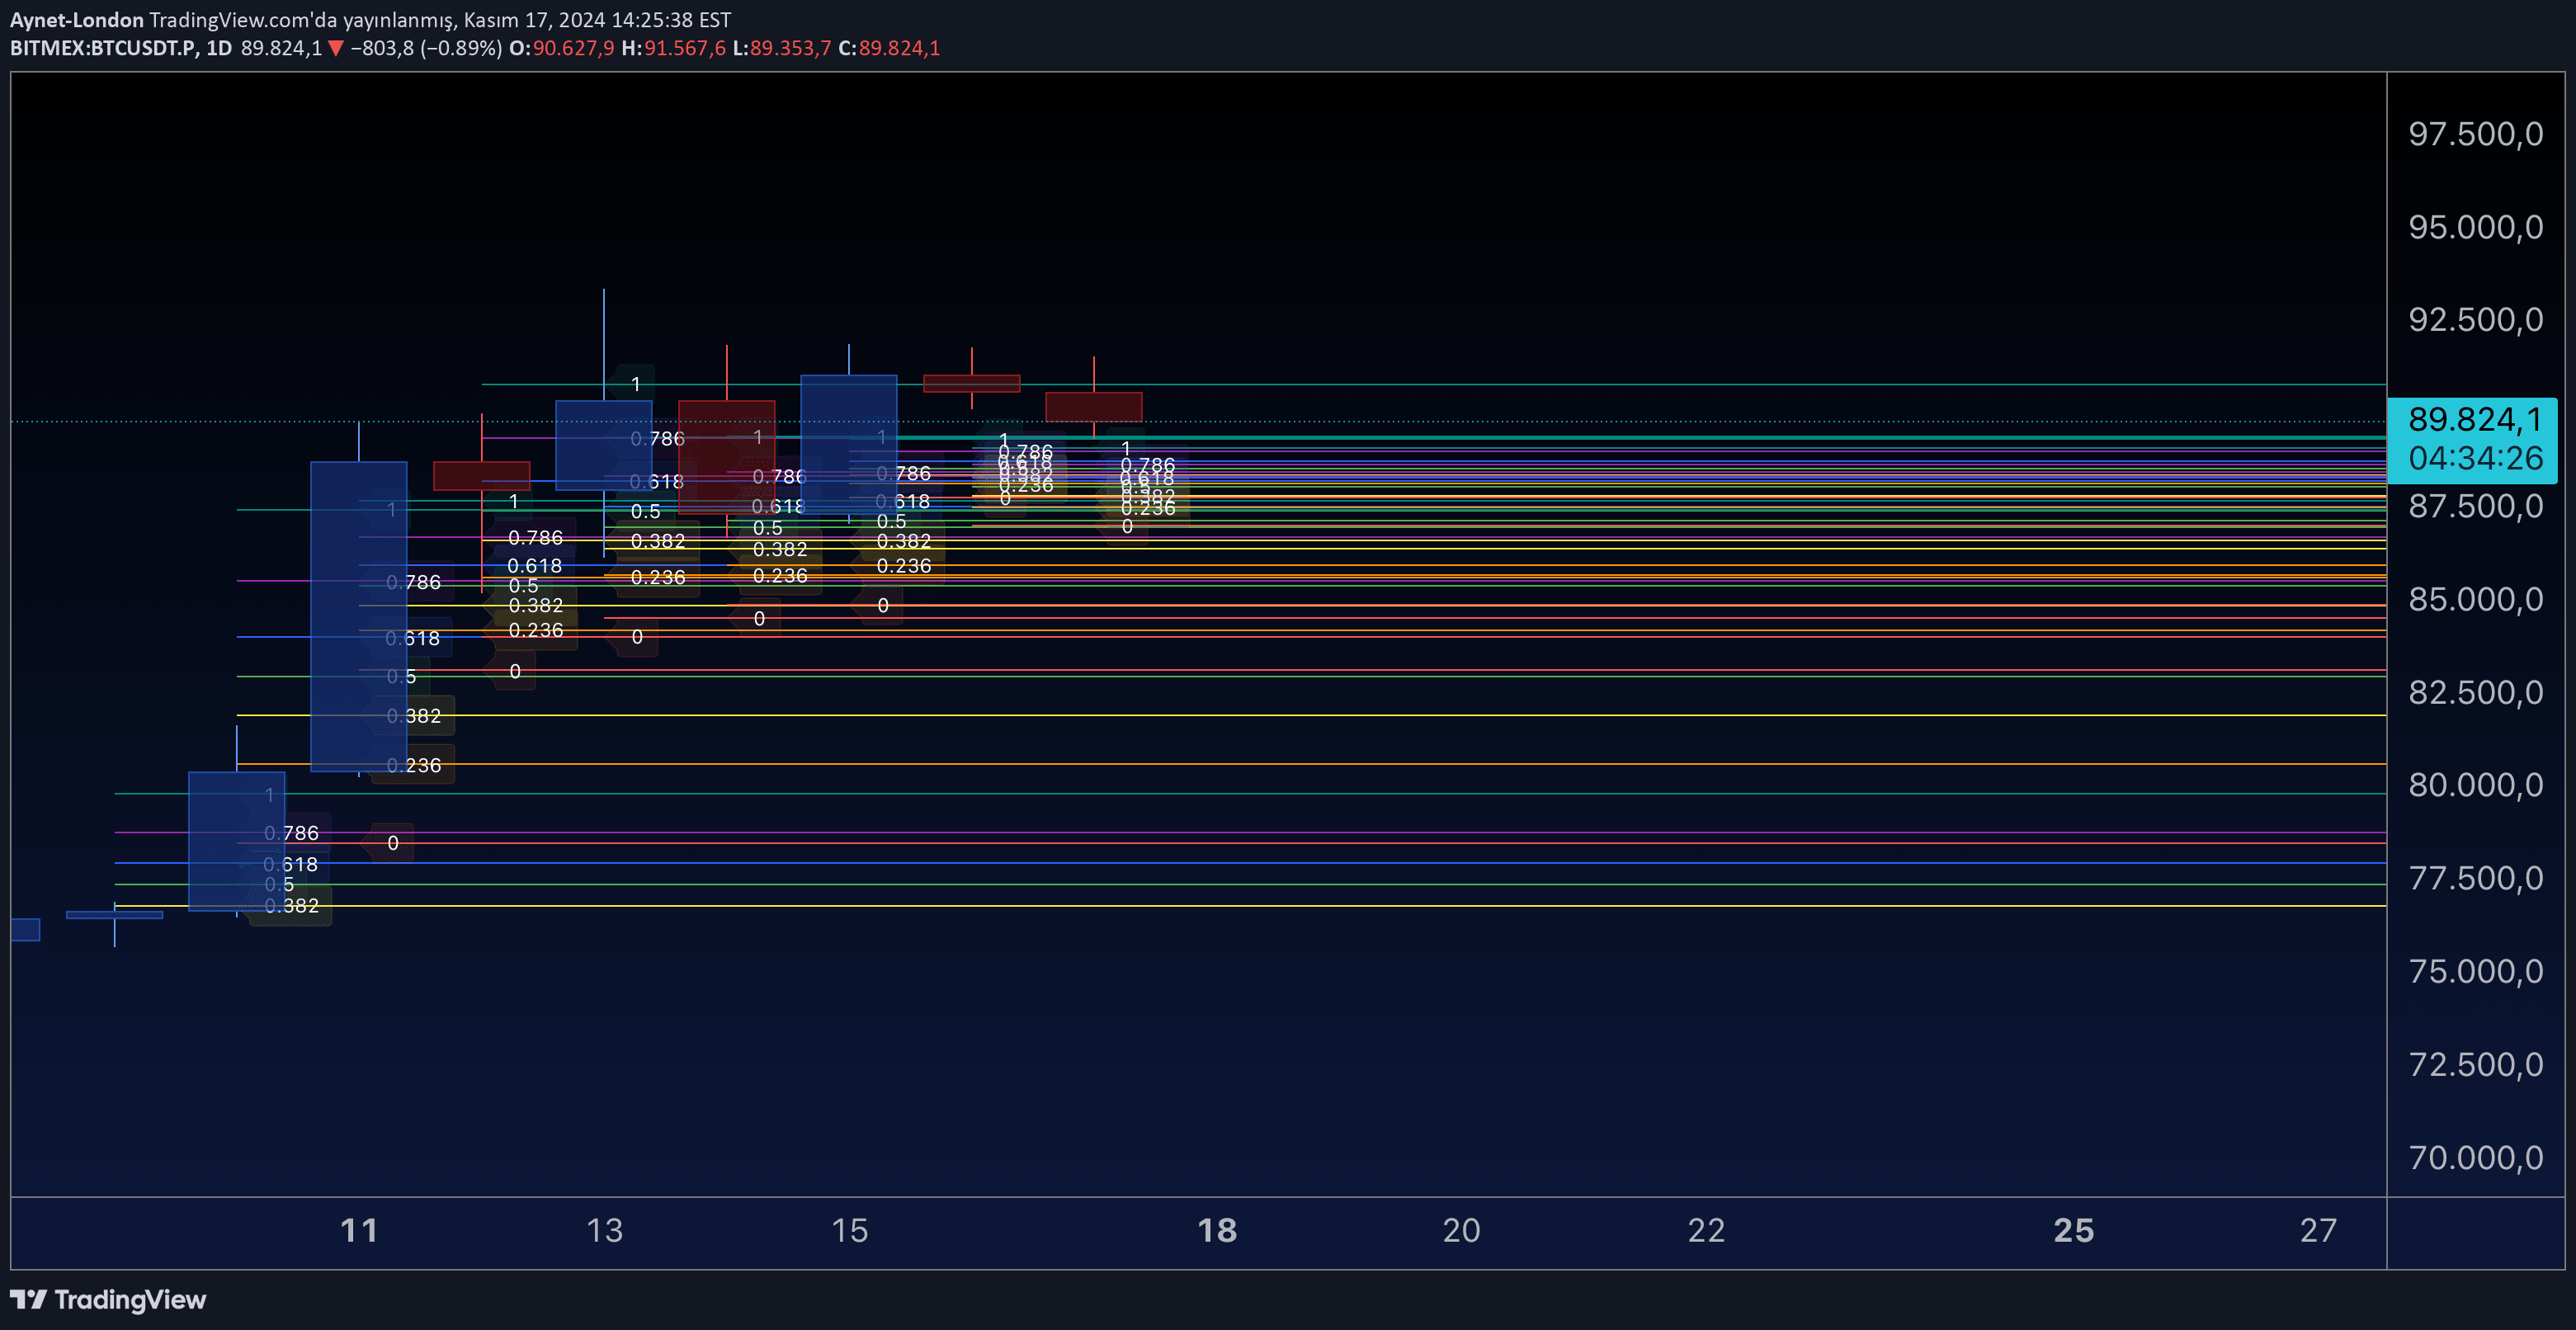
A dynamic Fibonacci retracement tool that calculates support and resistance levels for individual candlesticks across multiple timeframes, providing microstructure analysis.
Explore complementary indicator rolesHow it works
The indicator generates Fibonacci retracement levels dynamically for each candlestick's high-low range using standard percentages like 23.6%, 38.2%, and 61.8%. It fetches open, high, low, and close prices for a specified lower timeframe using request.security, creating horizontal lines that represent potential support and resistance zones.
By recalculating these levels for every new candle, traders can visualize precise microstructure price movements. The tool allows customization of Fibonacci line colors and widths, and plots lower timeframe candlesticks directly on the current chart for comprehensive multi-timeframe analysis.
Why it may be useful
Fibonacci retracements provide traders with mathematically derived support and resistance levels that can help identify potential price reversal or continuation zones. These levels are based on key mathematical ratios found throughout nature and financial markets, offering traders objective reference points for entry, exit, and stop-loss decisions.
By applying Fibonacci levels to individual candlesticks, traders gain granular insights into price behavior, enabling more precise trade management. The dynamic nature of these levels helps traders adapt to changing market conditions and understand subtle price movements across different timeframes.
When to explore it
This Fibonacci retracement tool is most effective during trending markets with clear directional movement, where price tends to respect mathematical retracement levels. It works particularly well for traders analyzing microstructure price action, seeking precise entry and exit points within shorter timeframes like 1-hour or 4-hour charts.
Traders can leverage this tool during periods of consolidation or when looking to confirm potential support and resistance zones. It is especially useful for scalpers and day traders who require detailed insights into price behavior and want to identify potential reversal or continuation signals at a granular level.
Keep exploring
What we’ve verified
Access, alerts and repainting behaviour have not been independently verified for this indicator. Check the creator’s current publication and settings.
General descriptions and classifications are recovered research. Verified details above identify the specific checks we have completed. Check the creator’s current publication for later changes.