
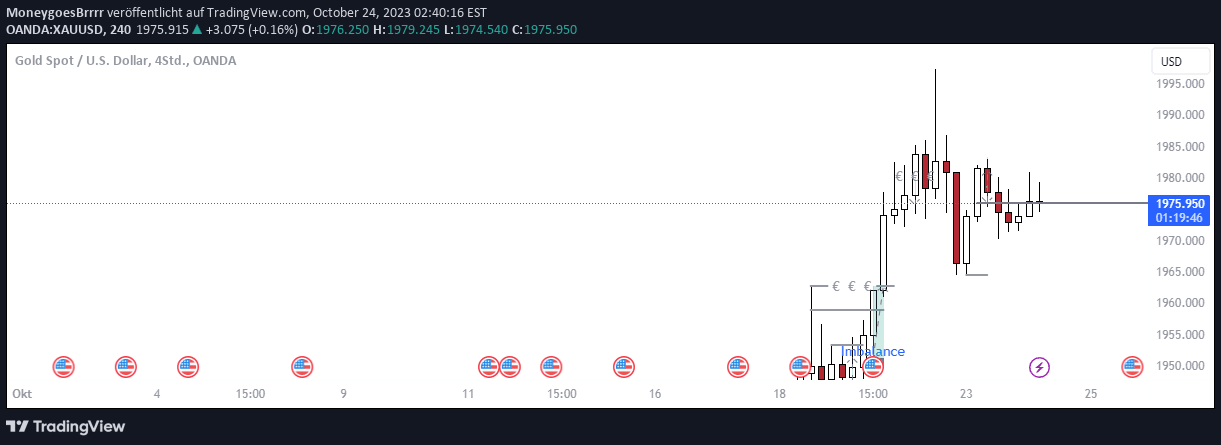
A unique candlestick pattern detector that identifies potential trend reversals by analyzing specific sequential candle formations, helping traders spot key market transition points.
Explore complementary indicator rolesHow it works
The Flat Combo Detector operates by meticulously analyzing consecutive candlestick patterns to detect potential trend reversals. It focuses on specific candlestick formations, particularly examining the relationship between bearish and bullish candles, their close and open prices, and their respective highs and lows.
The detector generates signals by plotting green triangles below price bars for bullish reversals and red triangles above price bars for bearish reversals. These signals are created when specific sequential candlestick conditions are met, such as a bearish candle with a close equal to its low followed by a bullish candle with an open near its low.
Why it may be useful
The Flat Combo Detector provides traders with a nuanced approach to identifying potential trend reversals that goes beyond traditional technical indicators. By focusing on specific candlestick patterns, it offers a more granular view of market sentiment and potential directional changes.
This approach allows traders to potentially catch early signs of trend transitions, giving them a strategic advantage in timing market entries and exits. The indicator's unique method of signal generation can help traders recognize subtle shifts in market dynamics that might be overlooked by more conventional analysis techniques.
When to explore it
The Flat Combo Detector is most effective in markets with clear, defined price movements and distinct trend characteristics. It works particularly well in trading instruments with good liquidity and consistent price action, such as major forex pairs, gold, and some stock indices.
Traders should use this signal in conjunction with other technical analysis tools to confirm potential trend reversals. It is especially useful during periods of market consolidation or when transitioning between trending and ranging market conditions, providing additional confirmation for traders seeking high-probability entry and exit points.
Keep exploring
What we’ve verified
Access, alerts and repainting behaviour have not been independently verified for this indicator. Check the creator’s current publication and settings.
General descriptions and classifications are recovered research. Verified details above identify the specific checks we have completed. Check the creator’s current publication for later changes.



