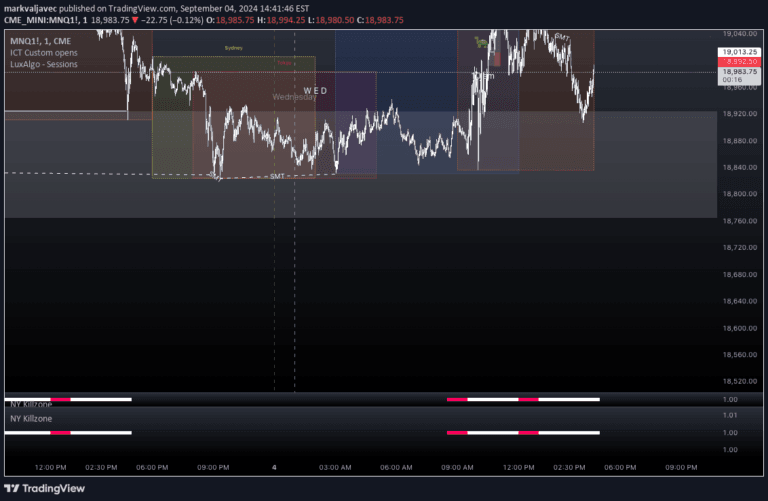
A flexible price range tool that allows traders to plot customizable horizontal lines within a specified price range, helping visualize key price levels and potential support/resistance zones.
Explore complementary indicator rolesHow it works
The price range tool enables traders to define a custom start and end price, automatically generating horizontal lines at specified intervals within that range. Users can configure the line color, width, and step size to suit their specific trading preferences and chart aesthetics.
By dynamically calculating and plotting lines between the chosen start and end prices, the tool provides a visual representation of potential price levels. Traders can adjust the line spacing and appearance to highlight important price zones, making it easier to identify potential support, resistance, or other significant price markers.
Why it may be useful
Customizable horizontal lines help traders quickly identify and visualize key price levels, which can be crucial for understanding market structure and potential entry or exit points. The flexible configuration allows traders to adapt the tool to different market conditions, trading styles, and individual chart preferences.
By providing a clear, visual representation of price ranges, this tool helps traders make more informed decisions. The ability to easily customize line color, width, and spacing makes it a versatile tool for technical analysis across various timeframes and trading strategies.
When to explore it
This price range tool is most effective when traders want to highlight specific price zones or create custom visual references on their trading charts. It works well in trending markets, range-bound markets, and during periods of consolidation where identifying key price levels is crucial.
Traders can use this tool across multiple timeframes, from scalping to swing trading, to mark important price levels, potential support and resistance zones, or to create visual guides for their trading decisions. It is particularly useful when analyzing historical price action or preparing for potential future price movements.
Keep exploring
What we’ve verified
Access, alerts and repainting behaviour have not been independently verified for this indicator. Check the creator’s current publication and settings.
General descriptions and classifications are recovered research. Verified details above identify the specific checks we have completed. Check the creator’s current publication for later changes.