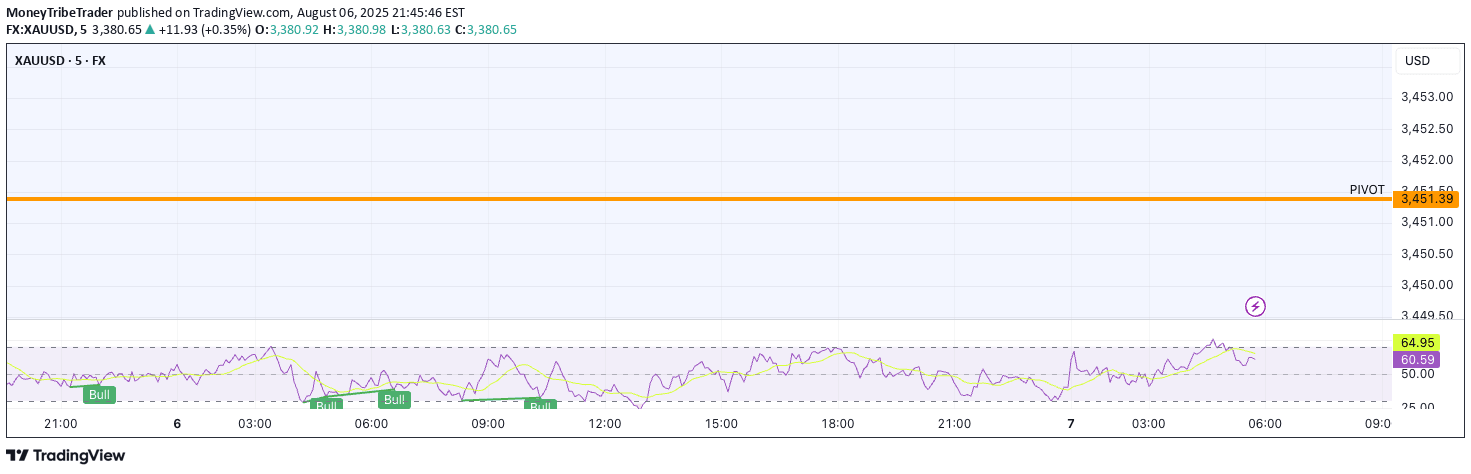
A visual aid displaying precise tick and point values in USD directly on the upper right corner of the trading chart, providing immediate financial context for traders.
Explore complementary indicator rolesHow it works
The trading chart's upper right corner integrates a dedicated table that calculates and displays real-time tick and point values in USD. This dynamic table provides traders with instant numerical representation of financial increments, enabling quick comprehension of potential profit or loss per market movement.
By presenting these precise monetary values, traders can rapidly assess the financial implications of each trade without performing manual calculations. The table acts as an immediate reference point, translating abstract price movements into concrete dollar amounts.
Why it may be useful
Understanding precise monetary values is crucial for effective risk management and strategic decision-making in trading. By displaying tick and point values in USD, traders can instantly gauge potential gains or losses, allowing for more informed and calculated trading approaches.
This real-time financial context helps traders make more precise entry and exit decisions, manage position sizing, and develop more disciplined trading strategies. The immediate visibility of monetary increments supports faster, more accurate financial assessment during active trading sessions.
When to explore it
This feature is most beneficial during active trading sessions across various market conditions and asset classes. Traders can leverage this tool when rapid financial assessment is critical, such as during volatile market movements or when making quick trading decisions.
The tick and point value display proves especially useful for scalpers, day traders, and swing traders who require instant monetary context. It is particularly valuable when trading instruments with variable tick sizes or when navigating markets with complex pricing structures.
Keep exploring
What we’ve verified
Access, alerts and repainting behaviour have not been independently verified for this indicator. Check the creator’s current publication and settings.
General descriptions and classifications are recovered research. Verified details above identify the specific checks we have completed. Check the creator’s current publication for later changes.