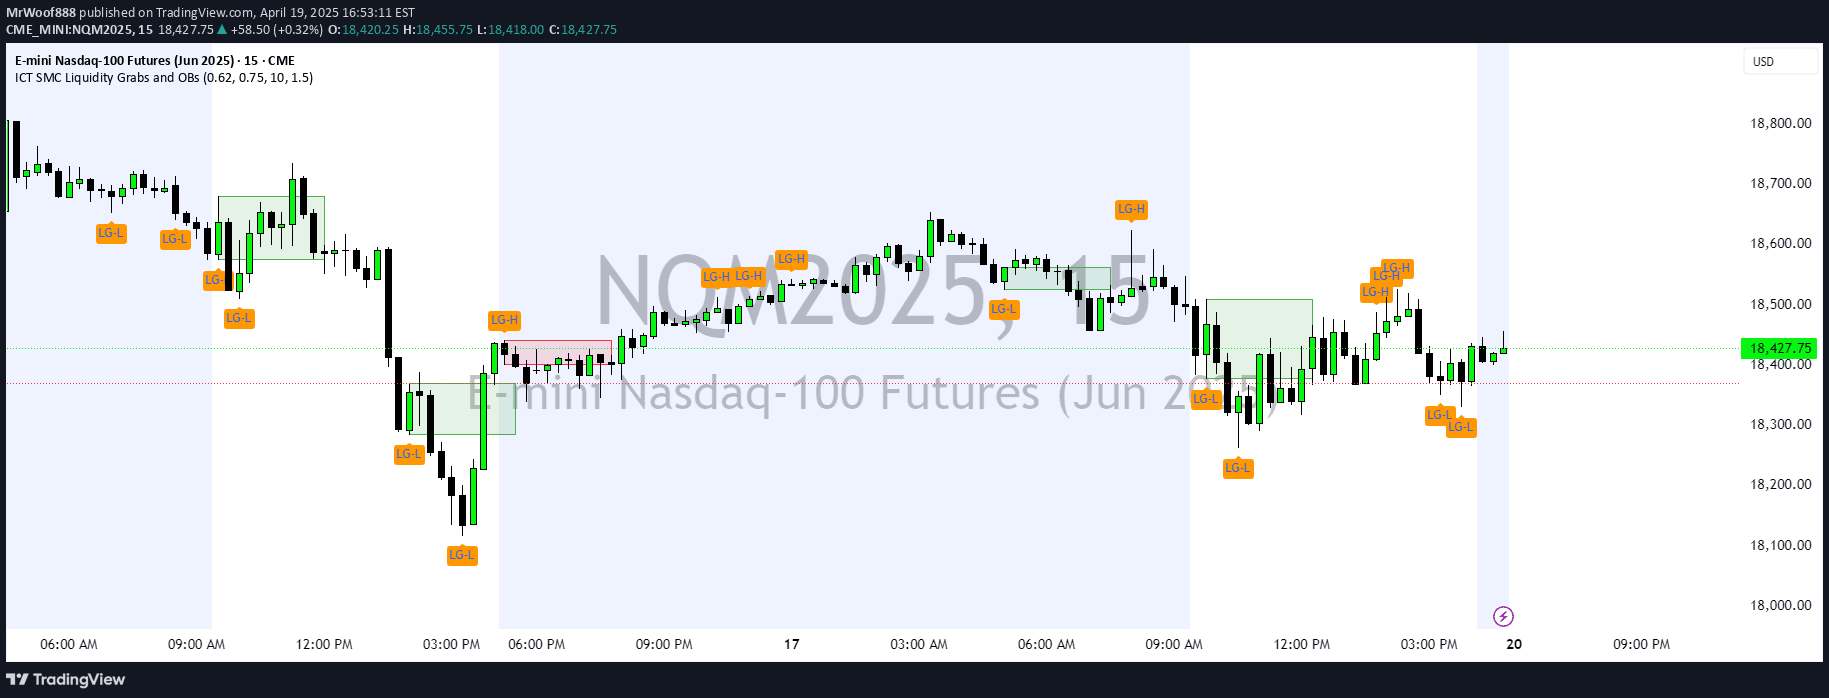
A trading tool that identifies Fair Value Gaps (FVGs) on price charts, highlighting potential price return zones and breakaway gaps using a three-candle pattern analysis.
Explore complementary indicator rolesHow it works
The Fair Value Gap (FVG) indicator identifies price areas created by a specific three-candle pattern where the third candle's position relative to the first two determines the gap's characteristics. For a bullish FVG, the low of the third candle must be higher than the high of the first candle, creating a visible price area that can act as a potential entry or target zone.
The indicator then classifies these gaps into two primary types: breakaway gaps and retracement gaps. Breakaway gaps are identified when the third candle closes decisively beyond the second candle's high or low, suggesting a potential strong momentum move, while gaps that might be returned to are those where the third candle does not fully break away from the previous candle's range.
Why it may be useful
Fair Value Gaps provide traders with a unique perspective on market structure and potential price movement dynamics by revealing hidden liquidity zones and momentum shifts. By identifying areas where price might seek equilibrium or experience significant movement, traders can develop more strategic entry and exit points based on these structural insights.
The method offers a systematic approach to understanding market behavior, helping traders anticipate potential price reactions and identify high-probability trading opportunities. It transforms seemingly random price movements into a more predictable framework by highlighting areas of potential price attraction and momentum changes.
When to explore it
Fair Value Gap analysis works best in markets with clear trends and consistent price structures, particularly in liquid and actively traded financial instruments like major forex pairs, stock indices, and prominent cryptocurrencies. Traders should apply this technique in timeframes that provide sufficient candle formations to generate meaningful gap analysis, typically ranging from 5-minute to daily charts.
The indicator is most effective when combined with other technical analysis tools and used in conjunction with broader market context and trend identification. Traders should exercise caution and conduct thorough backtesting to understand the indicator's performance across different market conditions and asset classes.
Keep exploring
What we’ve verified
Access, alerts and repainting behaviour have not been independently verified for this indicator. Check the creator’s current publication and settings.
General descriptions and classifications are recovered research. Verified details above identify the specific checks we have completed. Check the creator’s current publication for later changes.