
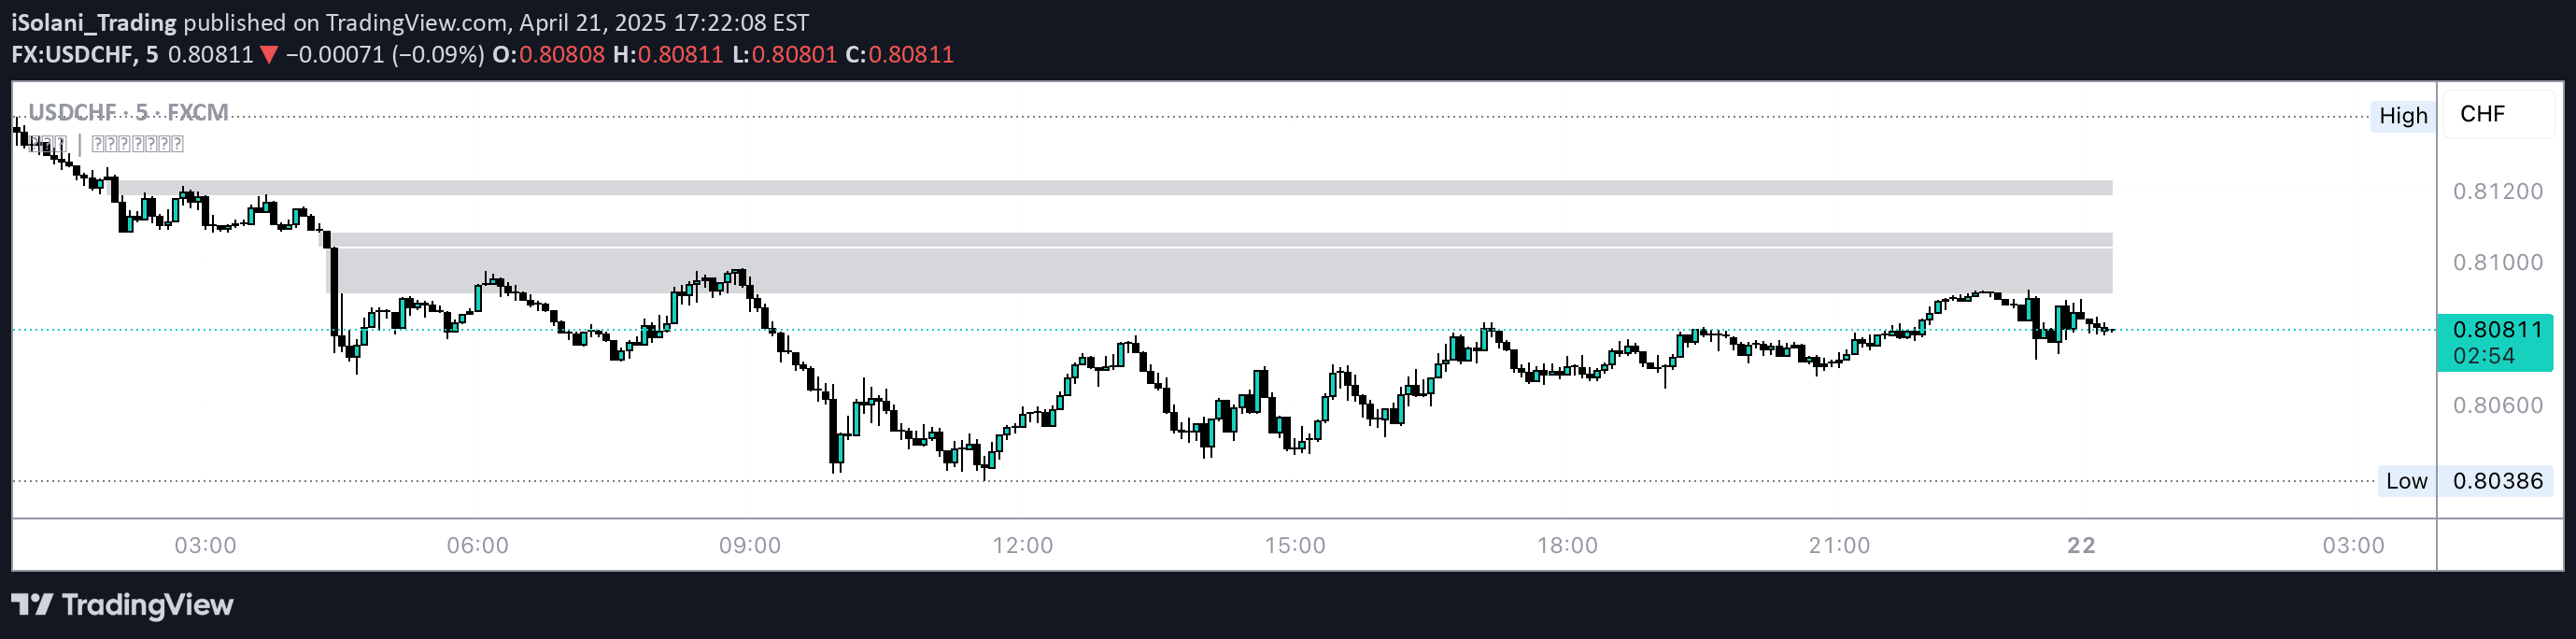
A sophisticated Fair Value Gap (FVG) indicator that identifies price imbalances by detecting zones where price skips valuation levels, creating potential trading opportunities.
Explore complementary indicator rolesHow it works
The FVG | iSolani indicator employs a multi-layered approach to detect market inefficiencies through gap analysis. It identifies price gaps by comparing current price action against previous bars, using a three-bar gap detection method that highlights bullish and bearish price movements.
The system then applies sophisticated filtering techniques, including volatility-adjusted thresholds and volume confirmation. It uses statistical analysis, measuring gaps against a 100-bar standard deviation and validating only gaps accompanied by above-average trading volume to ensure only significant price movements are highlighted.
Why it may be useful
This indicator provides traders with a powerful tool to uncover hidden market opportunities by revealing price imbalances that traditional analysis might miss. By focusing on volume-confirmed gaps, it helps traders identify potential retracement targets and understand institutional market activity.
The advanced filtering and automated zone management eliminate manual chart cleanup, allowing traders to concentrate on strategic decision-making. Its adaptive visualization and smart color encoding make complex market information more accessible and interpretable across different trading timeframes.
When to explore it
The FVG | iSolani indicator is most effective in markets with significant price movements and institutional activity. It works exceptionally well during trending markets, breakouts, and periods of high volatility where price action creates notable gaps between support and resistance levels.
Traders can leverage this tool across multiple timeframes, from scalping to swing trading, to identify potential entry and exit points. It is particularly useful for traders seeking to understand order flow, confirm trend reversals, and detect market inefficiencies with a data-driven approach.
Keep exploring
What we’ve verified
Access, alerts and repainting behaviour have not been independently verified for this indicator. Check the creator’s current publication and settings.
General descriptions and classifications are recovered research. Verified details above identify the specific checks we have completed. Check the creator’s current publication for later changes.


