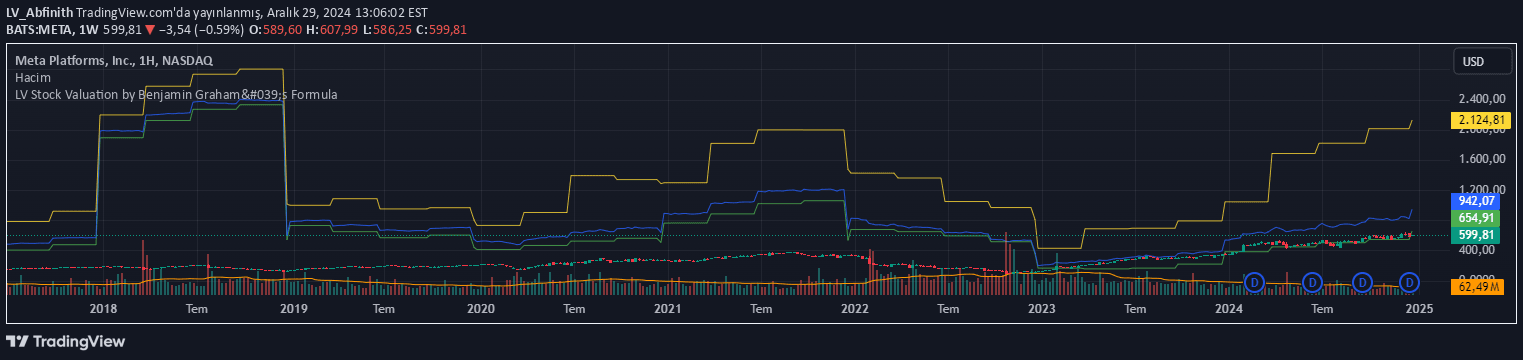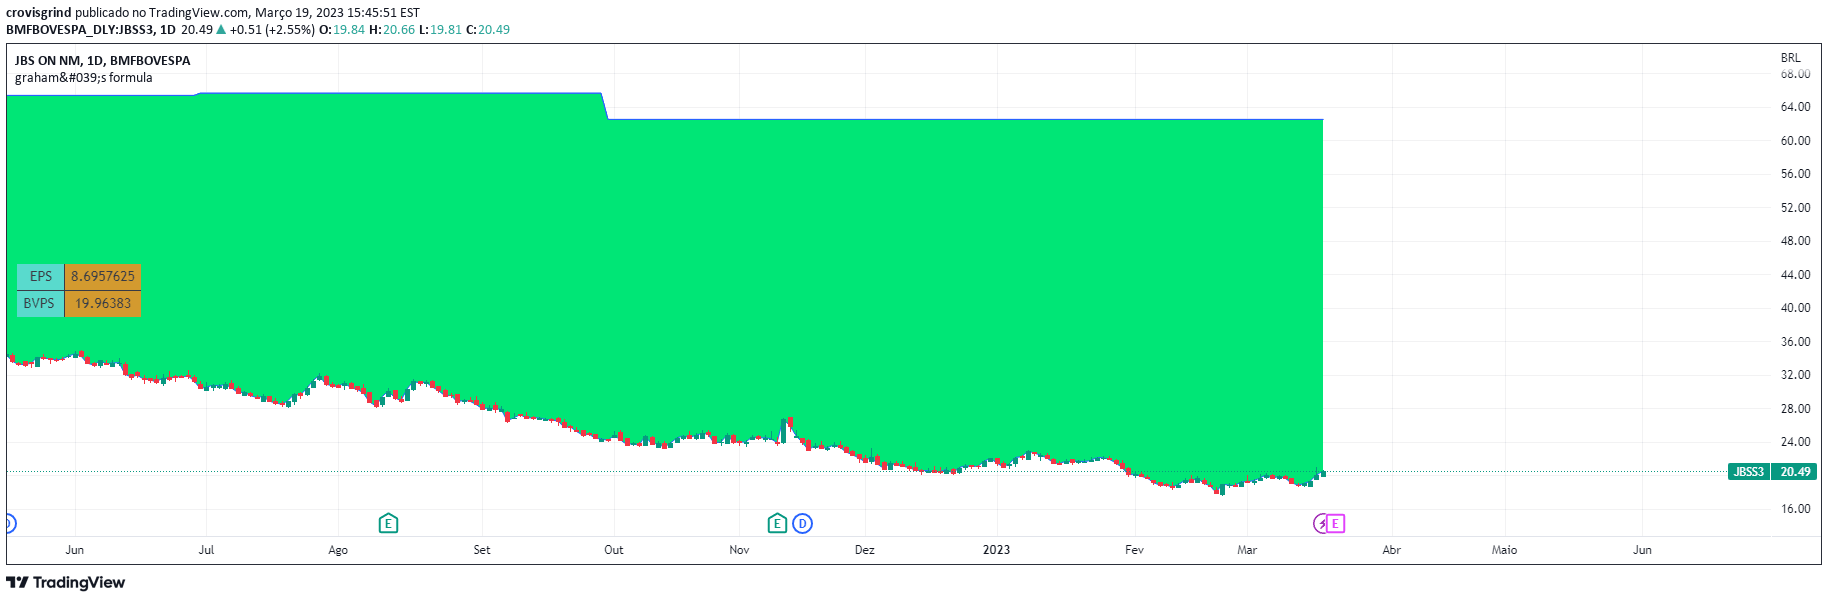
A stock valuation indicator using Benjamin Graham's formula to calculate fair value by analyzing earnings per share and book value per share, visualizing the gap between current price and intrinsic value.
Explore complementary indicator rolesHow it works
The Graham Fair Value indicator calculates a stock's intrinsic value using the formula VI = √(22.5 x EPS x BVPS), where VI represents the fair value, EPS is earnings per share, and BVPS is book value per share. This mathematical approach provides a systematic method to determine a stock's fundamental worth beyond its current market price.
The indicator plots a line representing the calculated fair value and colors the space between this line and the stock's closing price. By visually representing the difference between market price and intrinsic value, traders can quickly identify whether a stock is potentially undervalued or overvalued according to Graham's valuation methodology.
Why it may be useful
The Graham Fair Value indicator offers investors a structured approach to fundamental stock valuation, helping them make more informed investment decisions based on a stock's intrinsic worth. By providing a quantitative assessment of a company's value, it helps traders move beyond short-term market fluctuations and focus on long-term investment potential.
This method, developed by Benjamin Graham, the father of value investing, provides a disciplined framework for identifying potentially undervalued stocks. It encourages investors to look deeper into a company's financial fundamentals rather than relying solely on market sentiment or technical indicators.
When to explore it
The Graham Fair Value indicator is most effective for investors practicing value investing strategies, particularly those interested in long-term, fundamental stock selection. It works best when analyzing stable, established companies with consistent earnings and book value growth, providing insights into potential investment opportunities.
Traders should use this indicator as part of a comprehensive analysis, combining it with other fundamental and technical research. It is particularly useful during market corrections or when seeking to build a diversified, value-oriented portfolio that focuses on stocks trading below their intrinsic value.
Keep exploring
What we’ve verified
Access, alerts and repainting behaviour have not been independently verified for this indicator. Check the creator’s current publication and settings.
General descriptions and classifications are recovered research. Verified details above identify the specific checks we have completed. Check the creator’s current publication for later changes.