A Pine Script indicator that detects high breakout patterns by analyzing price movements over a customizable lookback period, helping traders identify potential trend continuation signals.
Explore complementary indicator rolesHow it works
The Grok High Breakout Detector analyzes price action by examining a user-defined lookback period to identify when the current price breaks above the highest point within that timeframe. It scans the market using a configurable period length, typically defaulting to 40 days, but allowing traders to adjust the sensitivity of the breakout detection.
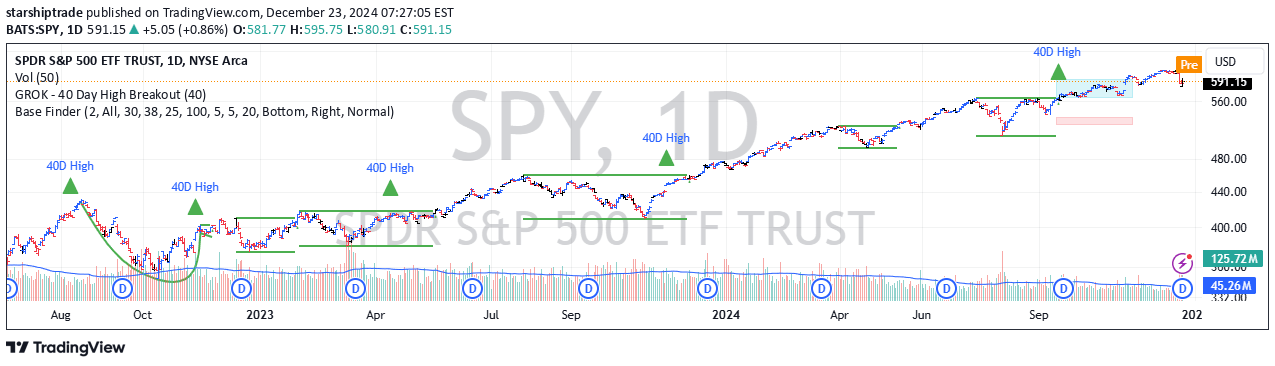
When a breakout occurs, the indicator generates a visual signal by placing a green triangle above the price bar, making it easy for traders to spot potential trend continuation opportunities. The script also generates a histogram plot compatible with screeners, enabling traders to quickly scan multiple instruments for breakout patterns.
Why it may be useful
Breakout signals are crucial for traders seeking to identify potential trend acceleration and momentum shifts in the market. By detecting when price moves beyond a recent high, traders can capture early entry points in emerging trends, potentially maximizing profit opportunities and reducing the risk of entering trades too late.
The customizable nature of this indicator allows traders to adapt the breakout detection to different market conditions and trading styles. Its versatility makes it valuable across various timeframes and asset classes, providing a flexible tool for trend-following strategies and momentum-based trading approaches.
When to explore it
The Grok High Breakout Detector is most effective in trending markets where price is showing clear directional movement and momentum. It works particularly well in markets with defined support and resistance levels, helping traders identify potential breakout opportunities that could signal the start of a new price trend.
Traders should use this indicator in conjunction with other technical analysis tools to confirm signals and reduce false breakout risks. It is especially useful for active traders who want to capture quick momentum moves in scalping, day trading, and swing trading scenarios across different financial instruments and timeframes.
Keep exploring
What we’ve verified
Access, alerts and repainting behaviour have not been independently verified for this indicator. Check the creator’s current publication and settings.
General descriptions and classifications are recovered research. Verified details above identify the specific checks we have completed. Check the creator’s current publication for later changes.