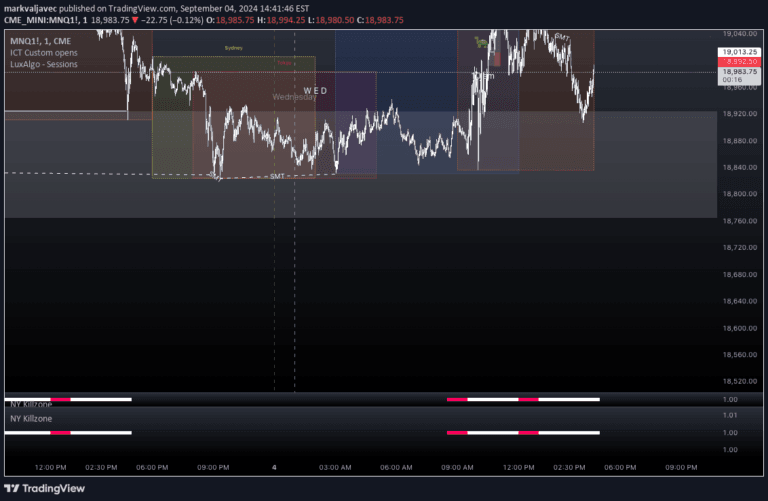
A custom trading indicator that displays horizontal lines marking key market session killzones for Asia, London, and New York, helping traders identify optimal trading windows.
Explore complementary indicator rolesHow it works
The indicator generates horizontal lines across the chart representing specific trading session times for global markets. It focuses on three primary market sessions: Asia, London, and New York, with predefined start and end times that traders can customize according to their preferences.
Each session is represented by a distinct horizontal line, allowing traders to visually understand the different market activity periods. The lines are configurable in terms of color and thickness, providing flexibility in how traders want to visualize these critical trading windows.
Why it may be useful
Understanding market session dynamics is crucial for traders seeking to optimize their entry and exit strategies. Different global market sessions have unique characteristics in terms of liquidity, volatility, and trading volume, which can significantly impact trading performance.
By clearly demarcating these sessions, traders can better plan their trades, anticipate potential market movements, and align their strategies with the most active and potentially profitable trading windows.
When to explore it
This indicator is most effective for intraday traders who focus on short-term market movements and want to capitalize on session-specific trading opportunities. It works best on timeframes up to and including the 1-hour chart, providing clear visual cues about market session transitions.
Traders should utilize this tool when they want to understand market session dynamics, identify potential entry and exit points, and synchronize their trading activities with the most active global market periods.
Keep exploring
What we’ve verified
Access, alerts and repainting behaviour have not been independently verified for this indicator. Check the creator’s current publication and settings.
General descriptions and classifications are recovered research. Verified details above identify the specific checks we have completed. Check the creator’s current publication for later changes.