
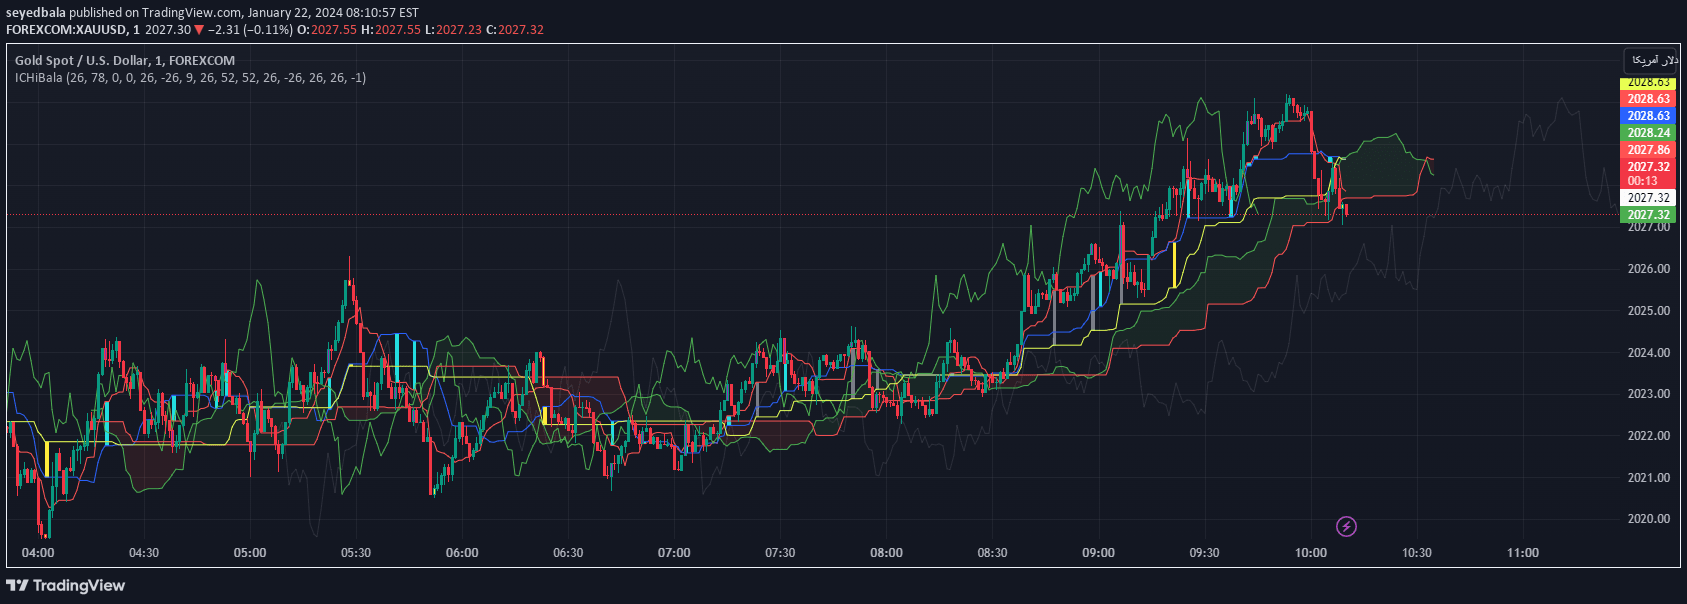
The Ichimoku Bala indicator is an advanced modification of the traditional Ichimoku Kinko Hyo, providing enhanced trend analysis and potential trading opportunity identification through multiple customizable lines and flat period detection.
Explore complementary indicator rolesHow it works
The Ichimoku Bala indicator calculates multiple lines including TenkanSen, KinjunSen, Senkou Spans, and additional custom lines to analyze price movements and trend dynamics. It uses various input parameters like periods and shifts to create a comprehensive view of market behavior, tracking the highest and lowest prices over specific intervals.
The indicator determines the flatness of key lines and identifies the start of flat periods, using color-coded visualizations to highlight different market conditions. By shifting and averaging various price metrics, it creates a multi-dimensional perspective of potential trend reversals and trading signals.
Why it may be useful
The Ichimoku Bala indicator provides traders with a sophisticated, multi-layered approach to market analysis, offering insights beyond traditional single-metric indicators. Its complex calculation method allows for a more nuanced understanding of price movements, trend strength, and potential market transitions, helping traders make more informed decisions.
By incorporating multiple lines and custom modifications, the indicator offers a comprehensive view of market dynamics, enabling traders to detect subtle changes in trend direction and momentum. The color-coded visualization helps quickly identify different market conditions, making complex market information more accessible and interpretable.
When to explore it
The Ichimoku Bala indicator is most effective in markets with clear trending characteristics, particularly in liquid and volatile financial instruments like forex, stocks, and cryptocurrencies. Its multiple line calculations and flat period detection make it especially useful during periods of potential trend reversal or consolidation.
Traders should utilize this indicator in timeframes ranging from short-term scalping to longer-term swing trading, adjusting its parameters to match specific market conditions and trading strategies. It is particularly valuable when combined with other technical analysis tools to confirm signals and provide a more comprehensive market analysis.
Keep exploring
What we’ve verified
Access, alerts and repainting behaviour have not been independently verified for this indicator. Check the creator’s current publication and settings.
General descriptions and classifications are recovered research. Verified details above identify the specific checks we have completed. Check the creator’s current publication for later changes.


