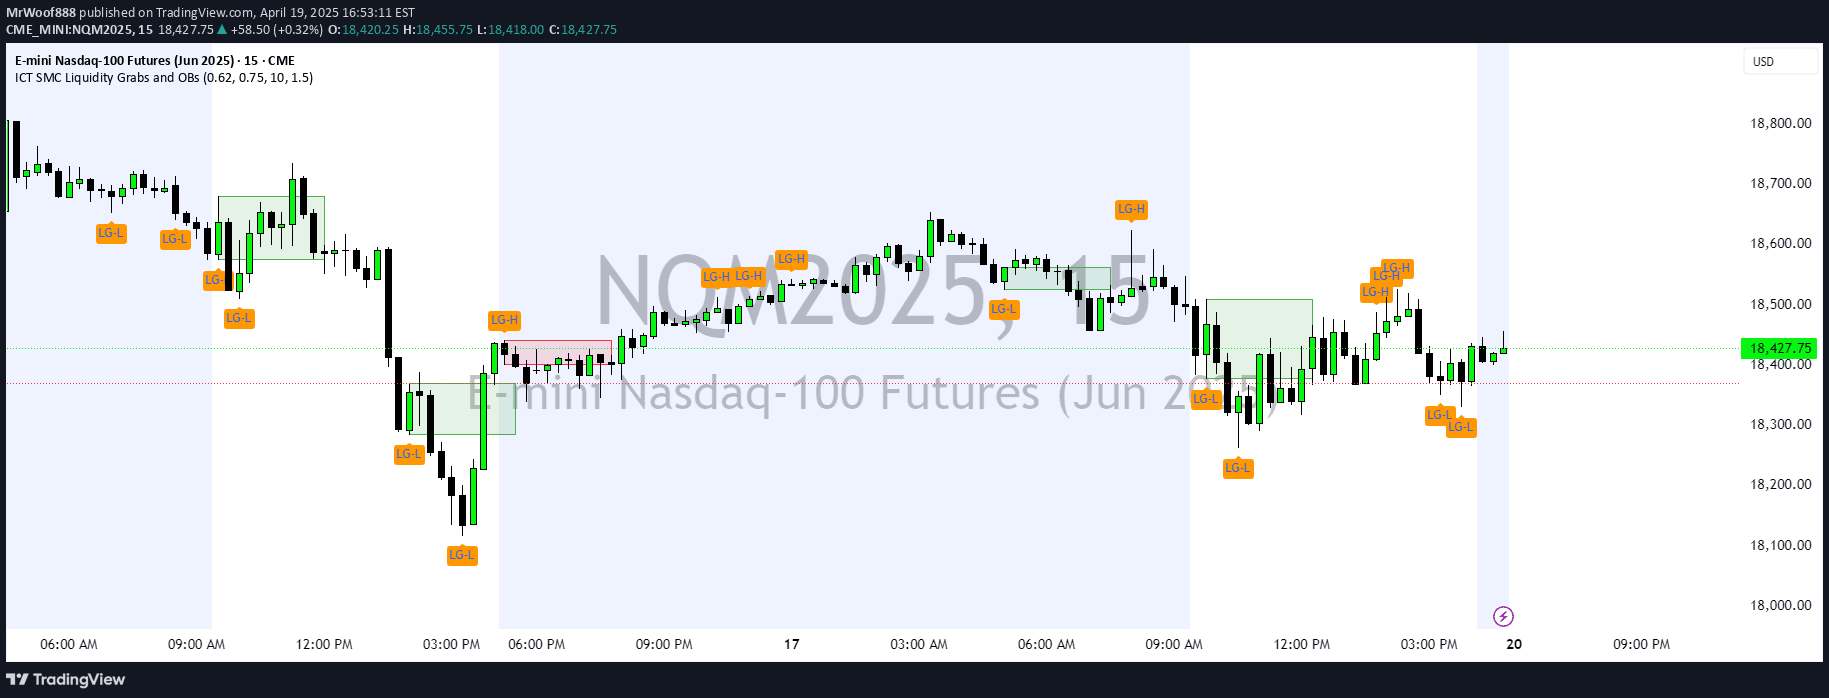
A trading tool that identifies Fair Value Gaps (FVG) and Inverse Fair Value Gaps (iFVG) to help traders detect potential market reversals and trading opportunities.
Explore complementary indicator rolesHow it works
The signal first detects Fair Value Gaps (FVG) by identifying price gaps between Candle 1 and Candle 3, distinguishing between bullish and bearish scenarios. For a bullish FVG, Candle 1's high is below Candle 3's low, while a bearish FVG occurs when Candle 1's low is above Candle 3's high.
After detecting an FVG, the script monitors the subsequent 5 candles for an inverse fair value gap (iFVG). A bullish FVG transforms into a bearish iFVG if the price closes below Candle 1's high, and conversely, a bearish FVG becomes a bullish iFVG if the price closes above Candle 1's low.
Why it may be useful
This signal provides traders with a sophisticated method to identify potential market reversals and trading opportunities based on price gaps and subsequent market behavior. By highlighting fair value gaps and their inverse formations, traders can gain insights into potential trend changes and market dynamics.
The visual representation through color-coded rectangles helps traders quickly recognize and interpret market movements, making complex price action more accessible and actionable.
When to explore it
The signal is most effective in markets with clear price movements and distinct candle formations, such as forex, futures, and actively traded stocks. It works best on timeframes ranging from 1-minute to 60-minute charts, providing versatility for different trading styles and strategies.
Traders should use this signal in conjunction with other technical analysis tools and confirm signals with additional indicators to increase the probability of successful trades.
Keep exploring
What we’ve verified
Access, alerts and repainting behaviour have not been independently verified for this indicator. Check the creator’s current publication and settings.
General descriptions and classifications are recovered research. Verified details above identify the specific checks we have completed. Check the creator’s current publication for later changes.