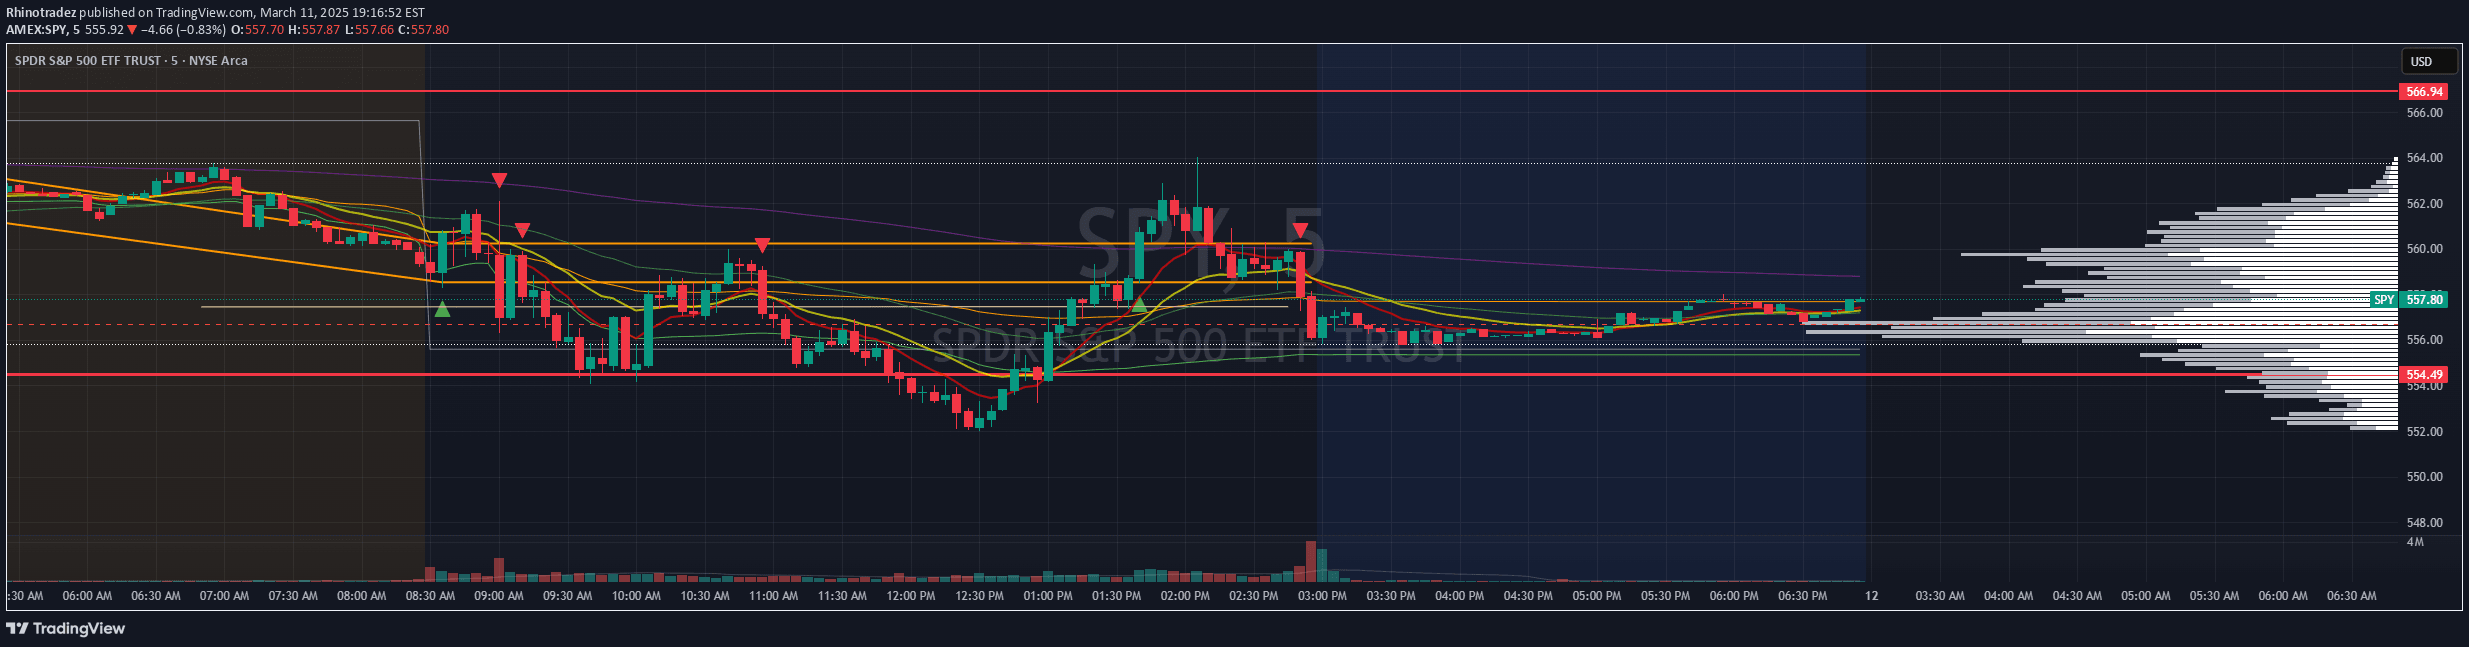
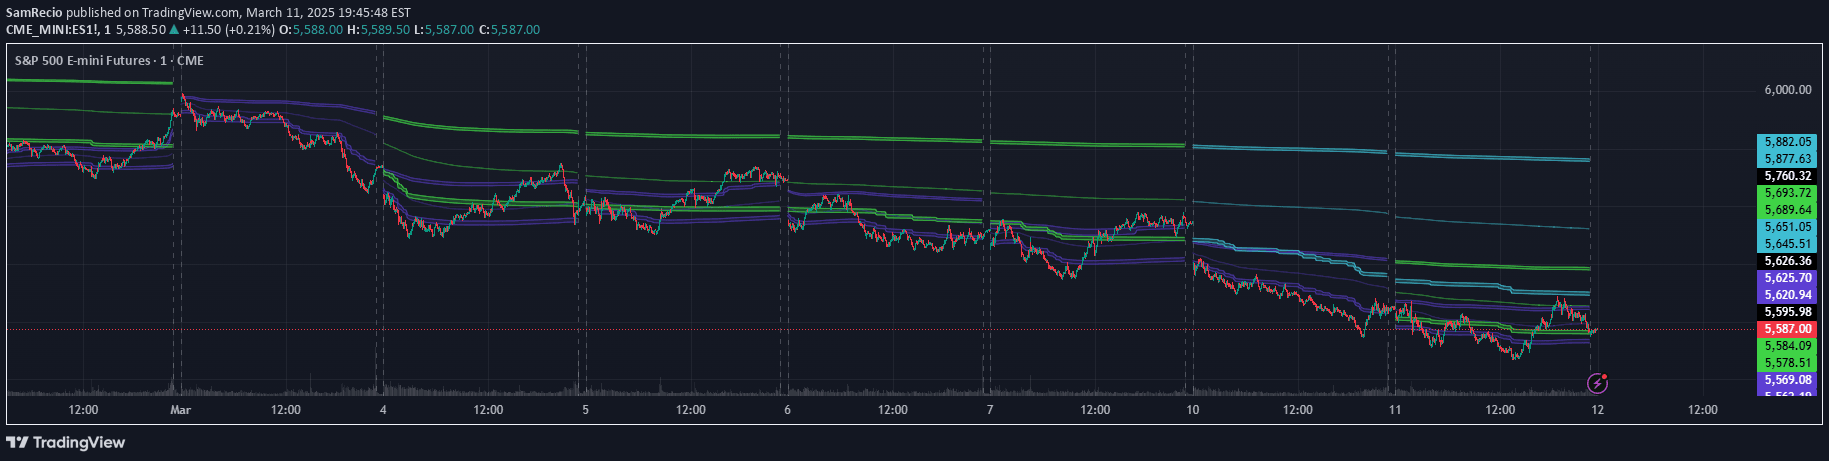
An ICT Opening Range indicator that visualizes key market price levels during specific trading sessions, helping traders understand algorithmic price boundaries and potential movement directions.
Explore complementary indicator rolesHow it works
The ICT Opening Range indicator analyzes a specific 30-minute trading session to establish critical price levels and algorithmic boundaries. It calculates the session's opening price, high, and low points, then divides the range into quadrants to identify premium and discount zones.
The indicator projects potential price targets using configurable standard deviation multiples, creating both positive and negative extensions from the initial range. These projections help traders visualize potential market movements beyond the opening session by symmetrically extending levels from the range's extreme points.
Why it may be useful
The ICT Opening Range provides traders with a structured framework for understanding market dynamics during crucial trading sessions. By revealing algorithmic price levels and internal range subdivisions, it offers insights into potential market behavior and structural boundaries that might influence trading decisions.
These visualized levels help traders anticipate price movements, identify early structural opportunities, and align their strategies with algorithmic price interactions. The indicator transforms abstract market movements into tangible, measurable reference points that can enhance strategic decision-making.
When to explore it
The ICT Opening Range indicator works best during specific market sessions like New York midnight, morning, or afternoon trading windows. It is particularly effective on 1-minute charts where precise price action can be closely observed and analyzed.
Traders should utilize this tool when seeking to understand market structure, identify potential displacement from initial ranges, and compare price reactions at significant algorithmic levels. It is most valuable during periods of known market activity and when precise time-based technical analysis is required.
Keep exploring
What we’ve verified
Access, alerts and repainting behaviour have not been independently verified for this indicator. Check the creator’s current publication and settings.
General descriptions and classifications are recovered research. Verified details above identify the specific checks we have completed. Check the creator’s current publication for later changes.