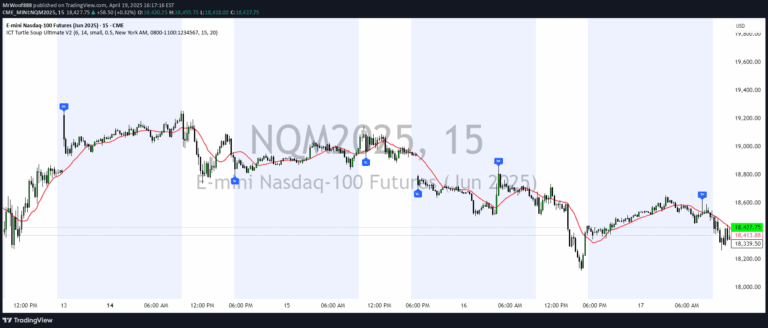
A technical indicator that highlights price gaps by drawing boxes between candles, helping traders identify potential areas of market interest and price skips.
Explore complementary indicator rolesHow it works
The gap indicator automatically identifies price discontinuities between consecutive candles, creating visual boxes that represent the size and direction of the gap. When a gap occurs, the indicator draws a rectangular box spanning from the closing price of one candle to the opening price of the next, effectively marking the price levels that were skipped.
These boxes are color-coded to distinguish between upward and downward gaps, providing traders with an immediate visual representation of market movement. The indicator ensures that the boxes do not extend beyond the actual gap, maintaining a clean and focused visualization of price action.
Why it may be useful
Gap indicators are valuable tools for traders seeking to understand sudden price movements and market dynamics. By highlighting price discontinuities, these indicators help traders quickly identify potential areas of market volatility and significant price shifts that might represent trading opportunities.
The visual representation allows traders to assess market sentiment, potential support and resistance levels, and areas of potential price consolidation or breakout. This can be particularly useful in volatile markets where price gaps can signal important changes in trader psychology and market momentum.
When to explore it
Gap indicators are most effective in markets with frequent price discontinuities, such as stocks, futures, and forex during periods of high volatility or around significant economic events. Traders can use these indicators to spot potential entry and exit points, especially when gaps represent significant market movements.
They are particularly useful for day traders and scalpers who need to quickly identify and react to rapid price changes. The indicator works best when combined with other technical analysis tools to confirm potential trading signals and provide a more comprehensive market analysis.
Keep exploring
What we’ve verified
Access, alerts and repainting behaviour have not been independently verified for this indicator. Check the creator’s current publication and settings.
General descriptions and classifications are recovered research. Verified details above identify the specific checks we have completed. Check the creator’s current publication for later changes.