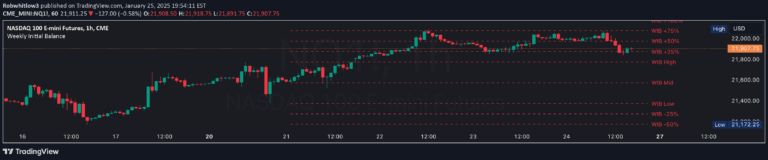
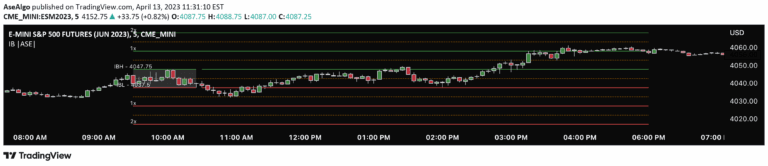
An automated trading tool that identifies the market's opening range during the first hour of trading, revealing potential support and resistance levels for strategic decision-making.
Explore complementary indicator rolesHow it works
The Initial Balance Indicator analyzes the first hour of market trading by identifying the high and low price levels during this period. It automatically draws a range based on these levels, creating a visual representation of the market's initial price movement.
Traders can use this range to understand potential market strength and direction. The indicator also generates extension levels at intervals of half the range's width, providing additional reference points for potential support and resistance zones.
Why it may be useful
The Initial Balance Indicator offers traders a structured approach to understanding early market dynamics by capturing the crucial first hour of trading. By visualizing the opening range, traders can gain insights into potential market sentiment and directional bias.
This tool helps traders make more informed decisions by providing clear, objective reference points for potential entry and exit strategies. The automatic identification of key levels reduces manual analysis time and helps traders quickly assess market conditions.
When to explore it
The Initial Balance Indicator is most effective during periods of high market volatility, particularly at market open when trading volume tends to spike. It is particularly useful for day traders and scalpers who rely on quick, short-term price movements.
Traders should pay special attention to this indicator when there are significant economic announcements or events that might impact market sentiment. The tool is especially valuable in liquid markets with consistent trading patterns, such as major stock indices or forex currency pairs.
Keep exploring
What we’ve verified
Access, alerts and repainting behaviour have not been independently verified for this indicator. Check the creator’s current publication and settings.
General descriptions and classifications are recovered research. Verified details above identify the specific checks we have completed. Check the creator’s current publication for later changes.