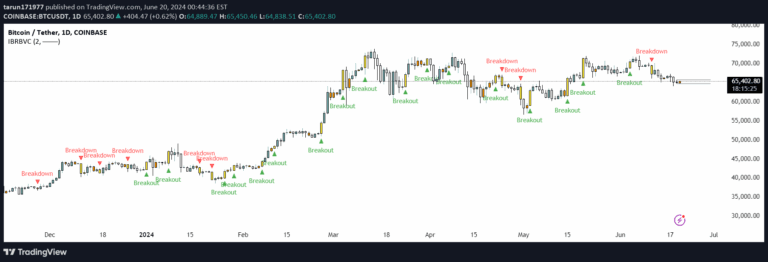
An advanced candlestick pattern indicator that identifies Inside Bars and InsideBar2 formations, helping traders recognize market consolidation and potential breakout opportunities.
Explore complementary indicator rolesHow it works
The Inside Bars IT indicator analyzes sequential candlesticks to detect specific pattern configurations where a current candle is completely contained within the previous candle's range. It identifies classic Inside Bars where the current candle's high is lower than the previous candle's high and its low is higher than the previous candle's low.
The indicator further extends this concept with InsideBar2, which uses the first Inside Bar's high and low as reference levels to classify subsequent candle patterns. By systematically tracking these nested candlestick formations, the indicator provides traders with a structured method to recognize potential market consolidation zones. It automatically flags these patterns, allowing traders to quickly identify periods of reduced volatility and potential upcoming price breakouts.
Why it may be useful
Inside Bar patterns are crucial for understanding market psychology and potential trend reversals or continuations. They represent moments of market indecision where buyers and sellers are in temporary balance, often preceding significant price movements. By systematically identifying these patterns, traders can gain insights into potential breakout opportunities and market sentiment shifts.
The indicator's ability to automatically detect and highlight these patterns saves traders considerable time and reduces subjective interpretation. It provides a quantitative approach to recognizing market consolidation, helping traders make more informed decisions about potential entry and exit points.
When to explore it
The Inside Bars IT indicator is most effective in markets experiencing ranging or consolidating conditions where price movement has temporarily stalled. It works particularly well in markets with moderate volatility, where clear trend directions are not immediately apparent. Traders can use this indicator across multiple timeframes to identify potential breakout opportunities in stocks, forex, commodities, and indices.
The indicator is especially valuable during periods of market uncertainty, such as before major economic announcements or during transitional market phases. Traders should combine the Inside Bars IT signals with other technical analysis tools to confirm potential trade setups and manage risk effectively.
Keep exploring
What we’ve verified
Access, alerts and repainting behaviour have not been independently verified for this indicator. Check the creator’s current publication and settings.
General descriptions and classifications are recovered research. Verified details above identify the specific checks we have completed. Check the creator’s current publication for later changes.