
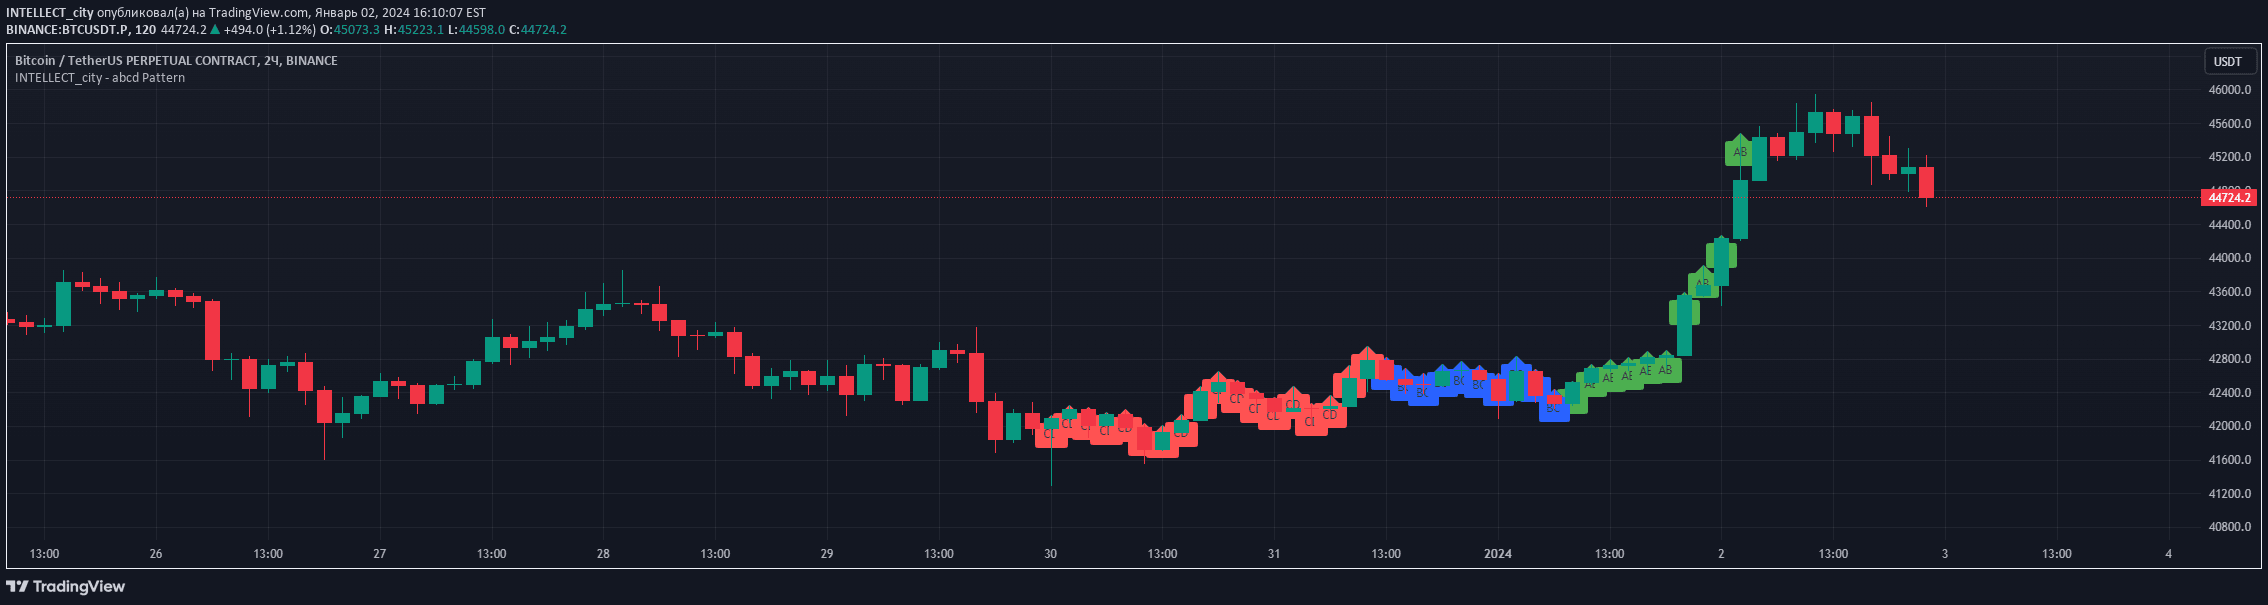
ABCD Pattern is a geometric trading indicator that identifies potential price movement patterns by tracking four distinct points: A, B, C, and D, helping traders analyze trend reversals and potential trading opportunities.
Explore complementary indicator rolesHow it works
The ABCD Pattern indicator tracks four specific points on a price chart to identify potential trading opportunities. Point A represents the start of the pattern and the end of a previous trend, while point B marks the top of the first price wave moving against the current trend.
Points C and D are crucial in completing the pattern, with point C representing the end of the second price wave and point D signaling the final point where price moves toward the original trend. The indicator displays lines connecting these points (AB, BC, and CD) and provides labels to help traders visualize the geometric price movement pattern.
Why it may be useful
The ABCD Pattern is valuable for traders because it provides a systematic approach to identifying potential trend reversals and price movement dynamics. By recognizing these geometric patterns, traders can gain insights into market psychology and potential trading entry and exit points.
This indicator helps traders understand price action more objectively by breaking down complex market movements into recognizable segments. It offers a visual framework for analyzing price trends, enabling traders to make more informed decisions about potential trade opportunities and risk management.
When to explore it
The ABCD Pattern works best in markets with clear trending characteristics and sufficient price volatility. It is particularly useful in stock, forex, and futures markets where price movements tend to follow more predictable geometric patterns. Traders should look for well-defined waves and clear trend transitions when applying this pattern.
Ideal usage includes combining the ABCD Pattern with other technical analysis tools and confirmation indicators. Traders should be cautious and not rely solely on this pattern, using it as part of a comprehensive trading strategy that includes risk management and additional market analysis techniques.
Keep exploring
What we’ve verified
Access, alerts and repainting behaviour have not been independently verified for this indicator. Check the creator’s current publication and settings.
General descriptions and classifications are recovered research. Verified details above identify the specific checks we have completed. Check the creator’s current publication for later changes.


