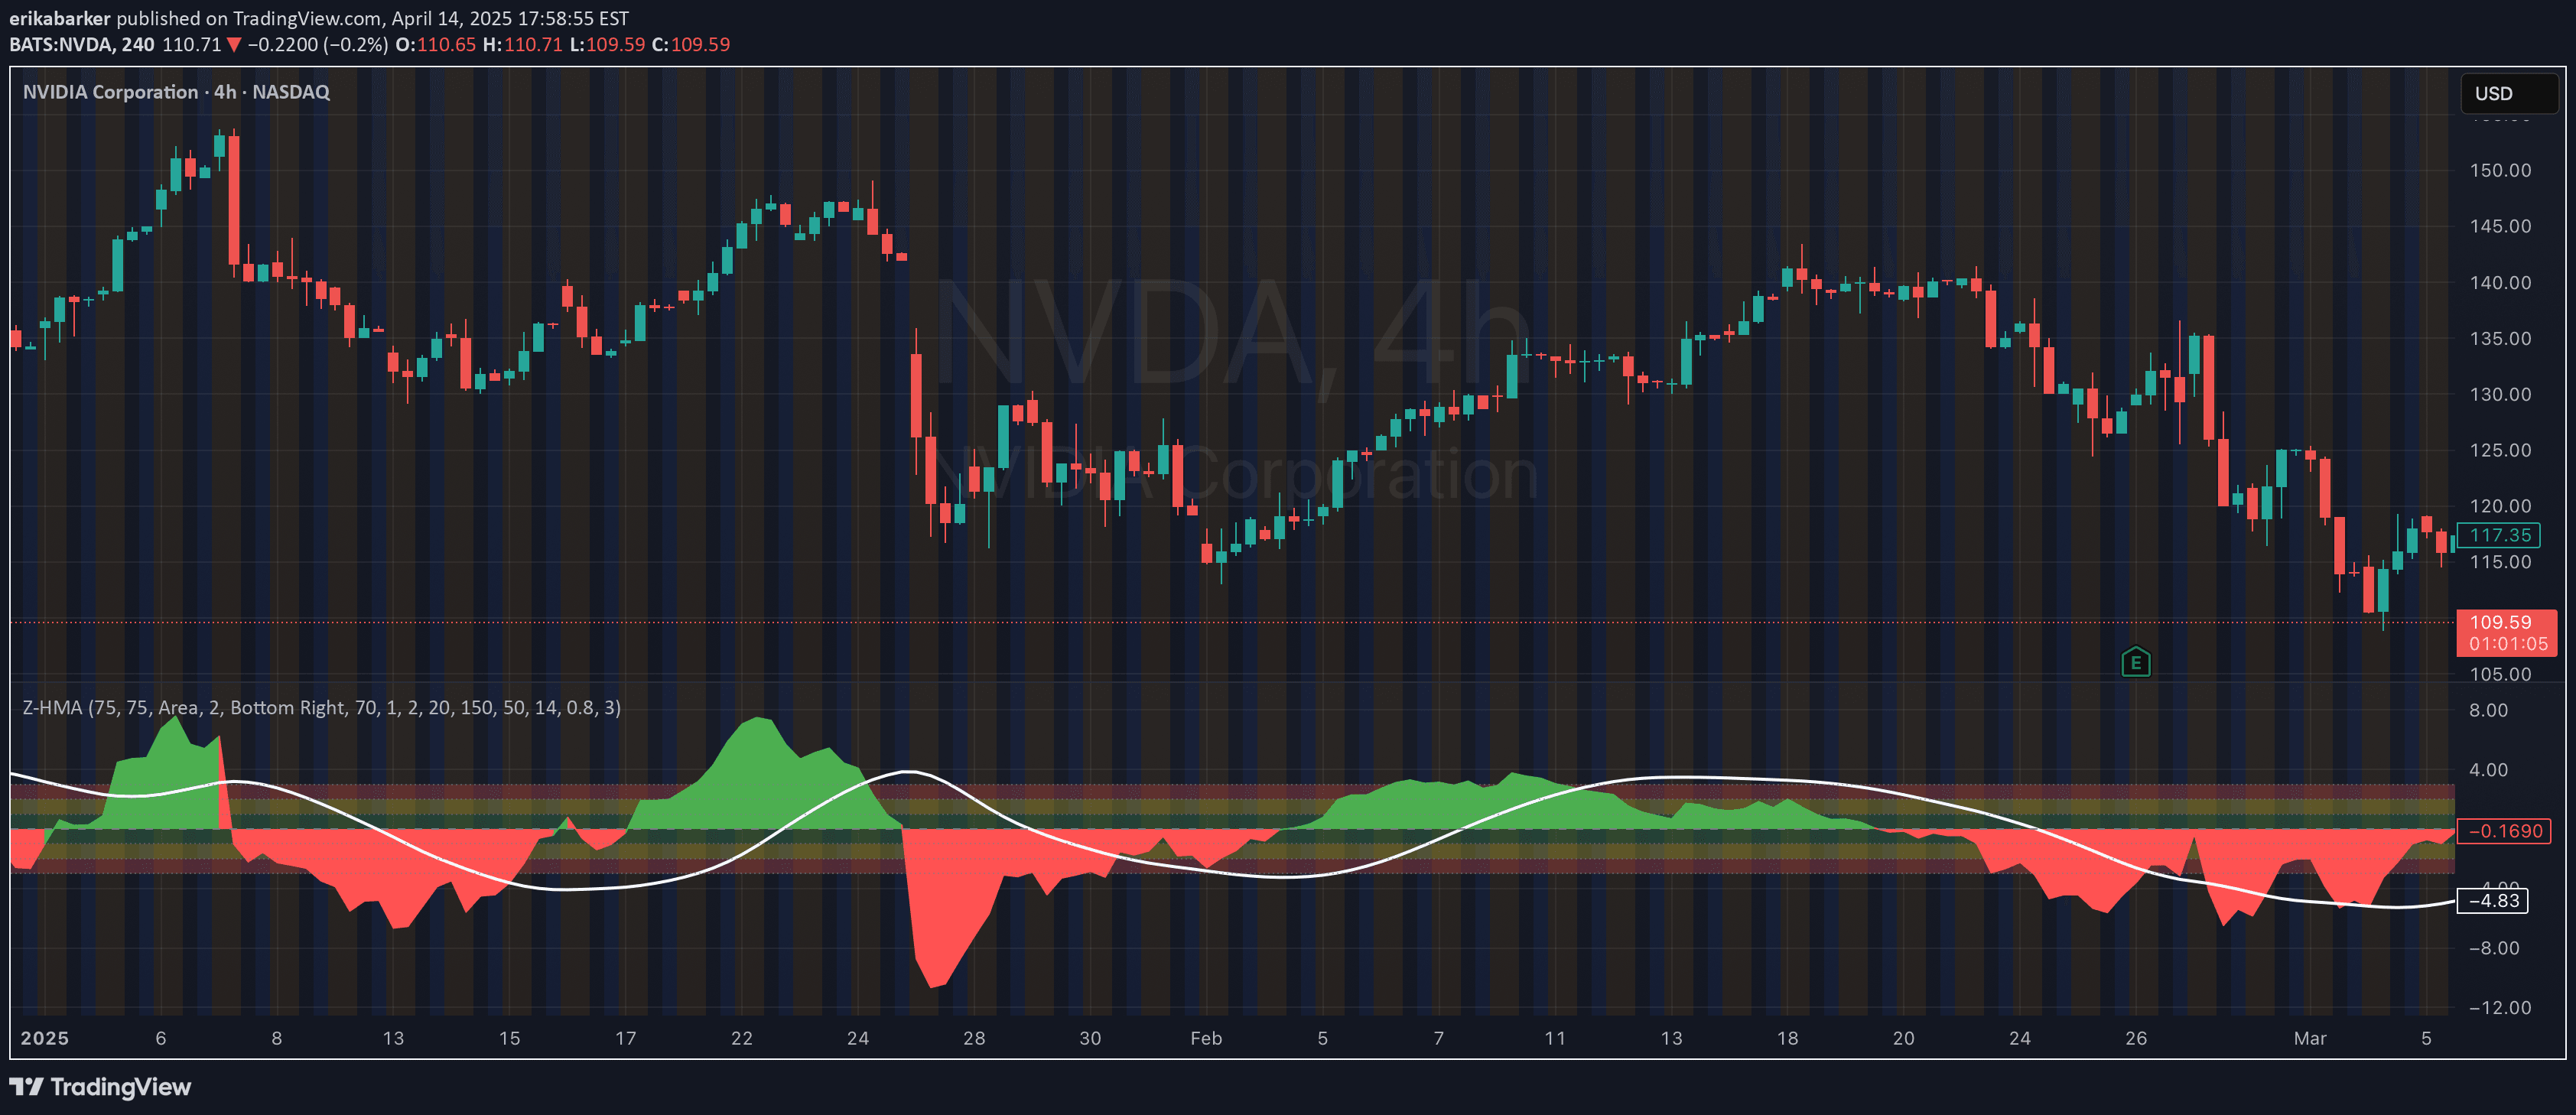
A trading signal that tracks intraday all-time high (ATH) and calculates percentage drawdown, providing visual insights into price movements and potential market corrections.
Explore complementary indicator rolesHow it works
The signal continuously tracks the highest price reached during the trading day, maintaining an intradayATH variable that updates whenever a new high is encountered. It calculates drawdown by measuring the difference between the current intraday high and the current closing price, then converts this into a percentage drawdown by dividing the drawdown by the intradayATH and multiplying by 100.
The percentage drawdown is plotted as a red line on the chart, allowing traders to visually monitor price retracements from the day's peak. Horizontal reference lines at 0%, 10%, and 20% provide additional context for interpreting the drawdown's significance, helping traders quickly assess market volatility and potential correction zones.
Why it may be useful
This signal provides traders with a real-time view of price retracements, helping them understand market sentiment and potential turning points during a trading session. By visualizing the percentage drawdown, traders can quickly assess how far prices have pulled back from their intraday highs, which can indicate market strength or weakness.
The reference lines at 0%, 10%, and 20% offer standardized benchmarks for evaluating market corrections and potential recession scenarios. These lines help traders make more informed decisions about entry, exit, and risk management, providing a structured approach to understanding price movements beyond simple price charts.
When to explore it
The percentage drawdown signal is most effective during volatile market conditions where rapid price movements can create significant retracements. It is particularly useful for day traders and scalpers who need to make quick decisions based on intraday price dynamics and potential trend reversals.
Traders should pay special attention to this signal when prices approach or cross the 10% and 20% drawdown lines, as these levels can indicate potential trend changes or significant market corrections. It is especially valuable in markets with high volatility, such as cryptocurrency, tech stocks, or during major economic announcements.
Keep exploring
What we’ve verified
Access, alerts and repainting behaviour have not been independently verified for this indicator. Check the creator’s current publication and settings.
General descriptions and classifications are recovered research. Verified details above identify the specific checks we have completed. Check the creator’s current publication for later changes.