
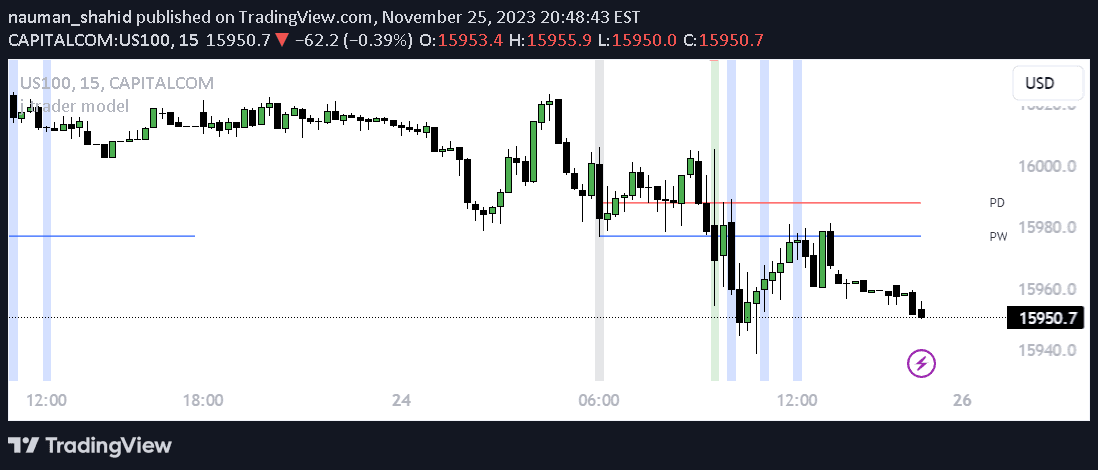
A trading indicator for indices using the jtrader model, focusing on key market phases like Power of 3, manipulation, and distribution with customizable settings.
Explore complementary indicator rolesHow it works
The jtrader model indicator operates by tracking specific market phases and key points of interest throughout a trading session. It begins by identifying the Power of 3 concept, which serves as a foundational element for market analysis and potential trade opportunities.
The indicator monitors critical market moments such as pre-NY open accumulation, NY market open manipulation, and subsequent distribution phases. It utilizes heatmap techniques to highlight potential trade entry and exit points, with a specific focus on 20-minute macro windows where indices demonstrate strong directional movements.
Why it may be useful
This indicator provides traders with a structured approach to understanding complex market dynamics by breaking down trading sessions into identifiable phases and key points of interest. It offers a systematic method for interpreting market manipulation, accumulation, and distribution patterns that are often challenging to recognize in real-time.
By offering customizable settings and comprehensive market phase tracking, the indicator empowers traders to make more informed decisions. Its ability to mark crucial swing points across different timeframes and highlight critical market moments can significantly enhance a trader's strategic planning and execution.
When to explore it
The jtrader model indicator is most effective when trading indices during active market sessions, particularly around the NY Stock Exchange opening at 9:30am. Traders should utilize this tool when seeking to understand and capitalize on market manipulation and distribution phases within short-term trading windows.
It is particularly valuable during volatile market conditions where quick identification of market phases can provide a competitive edge. Traders should leverage this indicator when they want a structured approach to interpreting market movements, with a focus on precise entry and exit points during critical trading sessions.
Keep exploring
What we’ve verified
Access, alerts and repainting behaviour have not been independently verified for this indicator. Check the creator’s current publication and settings.
General descriptions and classifications are recovered research. Verified details above identify the specific checks we have completed. Check the creator’s current publication for later changes.


