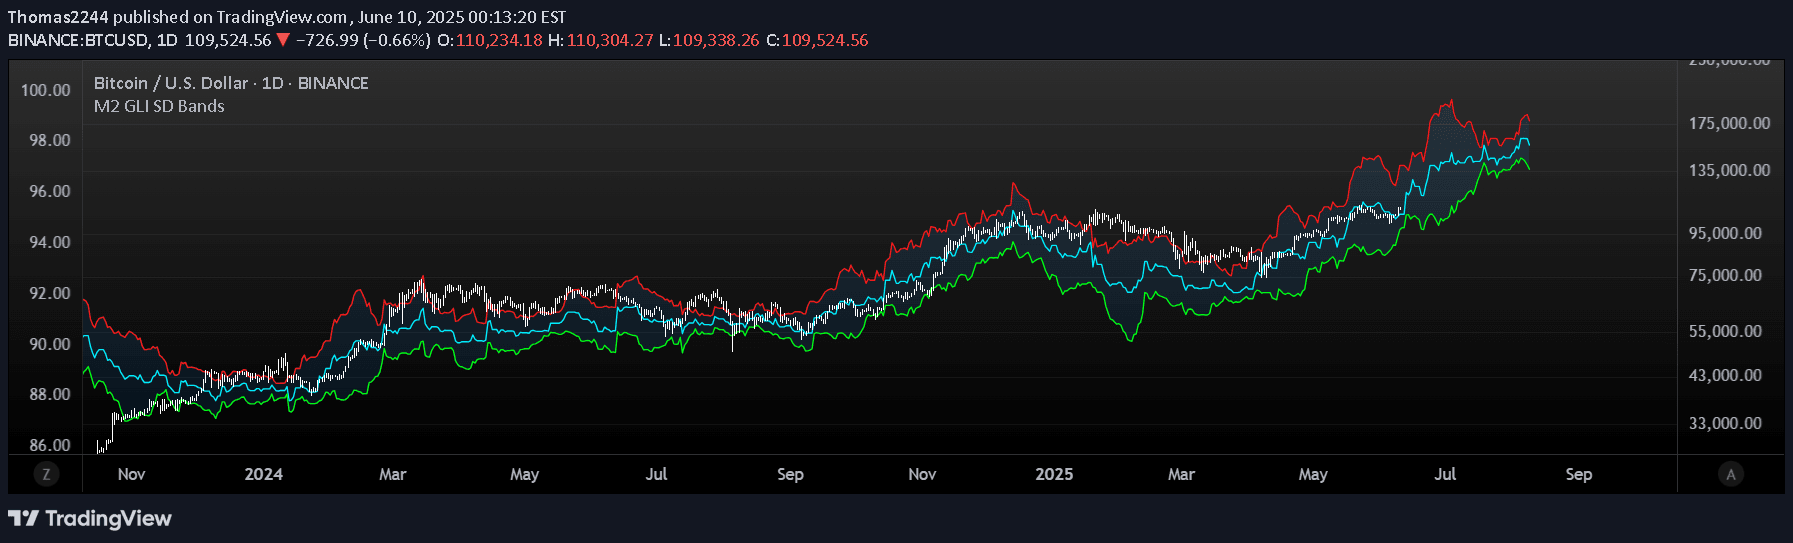
A multi-faceted trading indicator combining Bollinger Bands, EMAs, and Parabolic SAR to analyze market conditions, identify trends, and generate potential entry and exit signals.
Explore complementary indicator rolesHow it works
This indicator integrates three powerful technical analysis tools to provide comprehensive market insights. The Bollinger Bands track price volatility by creating upper and lower boundaries around a moving average, while the Exponential Moving Averages (EMAs) help identify trend direction and momentum across different timeframes.
The Parabolic SAR complements these tools by plotting dots above or below price candles to signal potential trend reversals. By combining these elements, traders can analyze market conditions through multiple technical perspectives, assessing short-term movements, overall trend strength, and potential entry or exit points.
Why it may be useful
Technical traders need robust, multi-dimensional analysis tools that can provide nuanced market insights beyond single-indicator strategies. This comprehensive approach allows traders to cross-reference different technical signals, reducing the likelihood of false signals and increasing confidence in trading decisions.
By integrating volatility measurement, trend identification, and reversal signals, traders can develop a more holistic understanding of market dynamics. The indicator's flexibility across different timeframes makes it valuable for various trading styles, from scalping to swing trading.
When to explore it
This indicator works best in markets with clear trending characteristics, where price movements are relatively consistent and not experiencing extreme choppiness or range-bound conditions. It is particularly effective in liquid markets with sufficient trading volume, such as major forex pairs, popular stock indices, and actively traded commodities.
Traders should be most cautious during periods of low liquidity, significant news events, or market transitions where trend signals might be less reliable. The indicator's effectiveness increases when used in conjunction with other confirmation tools and fundamental analysis.
Keep exploring
What we’ve verified
Access, alerts and repainting behaviour have not been independently verified for this indicator. Check the creator’s current publication and settings.
General descriptions and classifications are recovered research. Verified details above identify the specific checks we have completed. Check the creator’s current publication for later changes.