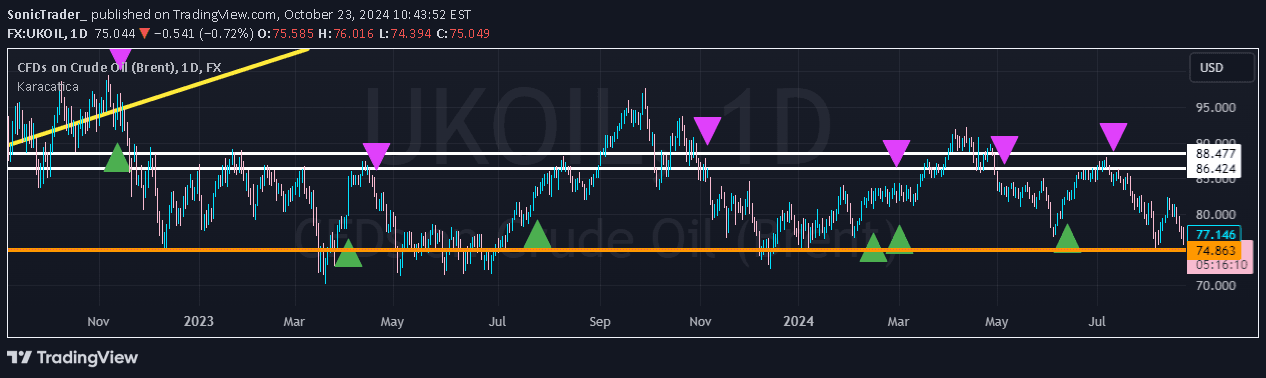
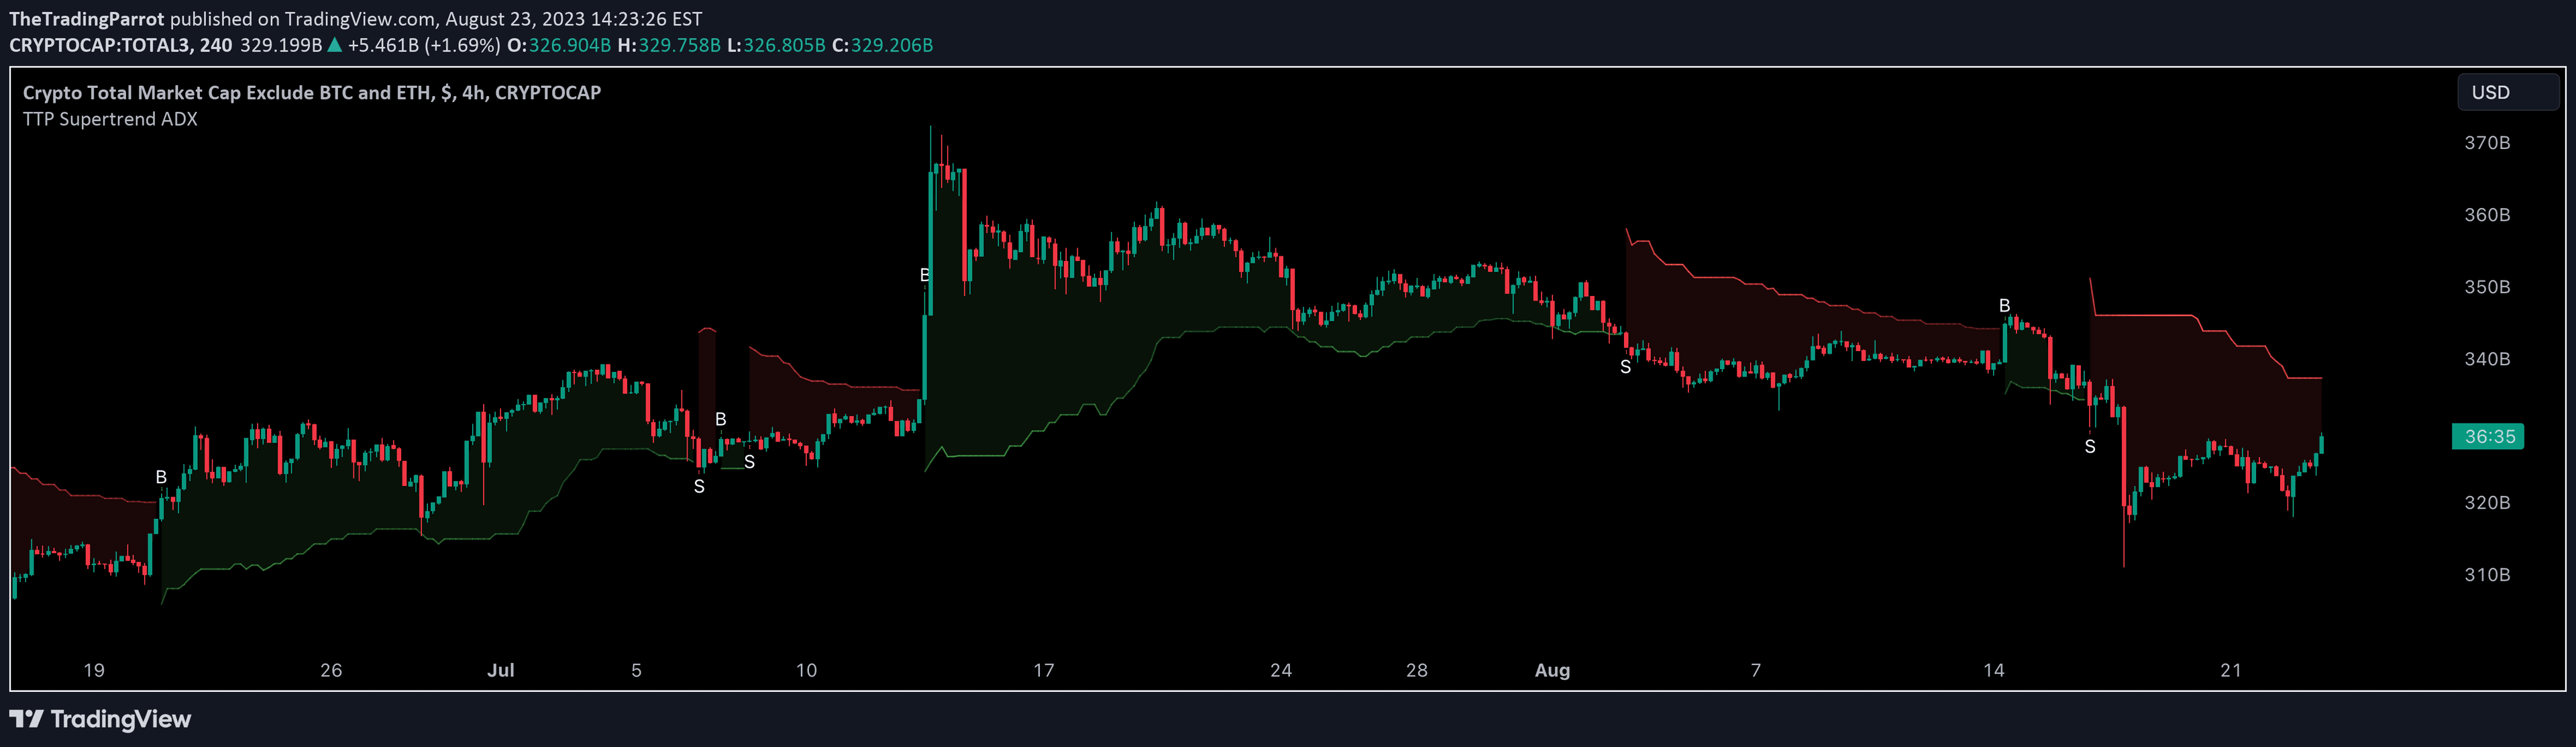
Kijun + ATR combines the Ichimoku Cloud's Kijun Base Line with Average True Range to provide trend direction and volatility-filtered trading signals.
Explore complementary indicator rolesHow it works
The Kijun + ATR indicator combines two key technical analysis components to generate trading signals. It first calculates the Kijun Base Line by finding the average of the highest and lowest price points over a specific time period, which helps identify trend direction.
The Average True Range (ATR) is then integrated to filter out market noise and provide a more robust signal. When the closing price is above the lower threshold and not below the upper threshold, the indicator generates a long signal in lime color. Conversely, when the closing price is below the upper threshold, it generates a short signal in fuchsia color.
Why it may be useful
The Kijun + ATR indicator provides traders with a sophisticated method of identifying potential market entry points by combining trend direction and volatility analysis. By integrating the Kijun Base Line from the Ichimoku Cloud with the ATR, traders can gain a more nuanced understanding of market movements and reduce false signals.
This approach helps traders make more informed decisions by considering both trend momentum and price volatility. The indicator's ability to filter out market noise can lead to more reliable trading signals, potentially improving overall trading strategy and risk management.
When to explore it
The Kijun + ATR indicator is most effective in trending market conditions, where clear directional movements provide more reliable signals. It works particularly well in markets with consistent momentum, allowing traders to capture substantial price movements with reduced noise.
However, traders should be cautious when using this indicator during consolidating market regimes, especially in bear markets or short consolidation periods during bull markets. In these conditions, the signal may generate less accurate results and potentially trigger false entry or exit points.
Keep exploring
What we’ve verified
Access, alerts and repainting behaviour have not been independently verified for this indicator. Check the creator’s current publication and settings.
General descriptions and classifications are recovered research. Verified details above identify the specific checks we have completed. Check the creator’s current publication for later changes.