A TradingView indicator that detects large candle shadows on XAU/USD 1-hour charts, highlighting potential price volatility and reversal signals through customizable thresholds.
Explore complementary indicator rolesHow it works
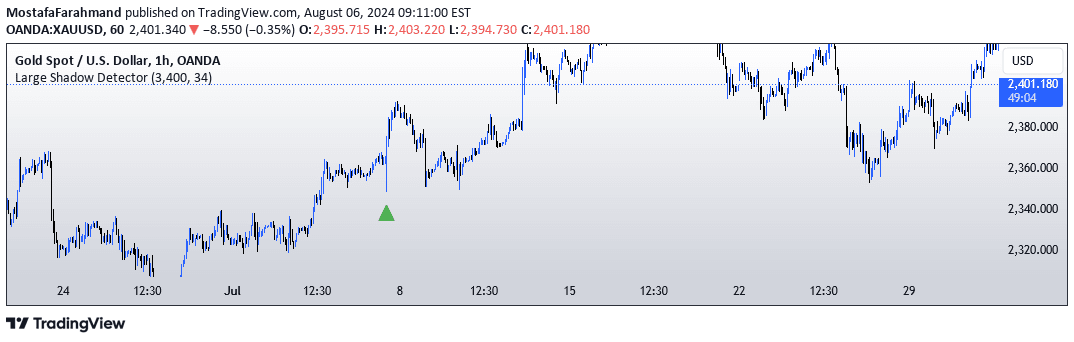
The Large Shadow Detector analyzes each candlestick's upper and lower shadows by measuring their length in points. Users can set a custom threshold, typically 3400 points, to identify significant price movements beyond the candle's body. When a shadow exceeds this predefined threshold, the script triggers a visual indicator, plotting red triangles for large upper shadows and green triangles for large lower shadows.
This method allows traders to quickly identify potential price volatility and extreme market sentiment shifts. By measuring the length of candle shadows, the indicator provides insights into the underlying market dynamics, revealing moments where prices have significantly deviated from the candle's central range.
Why it may be useful
Large shadow detection helps traders understand market volatility and potential trend reversals by highlighting extreme price movements. These significant shadows can indicate strong market sentiment shifts, potential exhaustion of current price trends, or imminent directional changes. By providing visual cues, the indicator allows traders to quickly assess market conditions without complex calculations.
The customizable threshold enables traders to adapt the indicator to different market conditions and trading styles. Recognizing these large shadows can help traders make more informed decisions about potential entry and exit points, manage risk more effectively, and gain deeper insights into market psychology.
When to explore it
The Large Shadow Detector is most effective in volatile markets with significant price fluctuations, such as during economic news releases, earnings reports, or periods of market uncertainty. It works particularly well on higher timeframes like 1-hour charts, where longer-term market movements are more visible. Traders can use this indicator to identify potential reversal points or assess market sentiment during critical trading periods.
The signal is especially useful for traders looking to capture short-term price movements or confirm existing trend strength. By highlighting extreme price actions, it can complement other technical analysis tools and provide additional context for trading decisions. Traders should combine this indicator with other confirmation signals to enhance its reliability and effectiveness.
Keep exploring
What we’ve verified
Access, alerts and repainting behaviour have not been independently verified for this indicator. Check the creator’s current publication and settings.
General descriptions and classifications are recovered research. Verified details above identify the specific checks we have completed. Check the creator’s current publication for later changes.