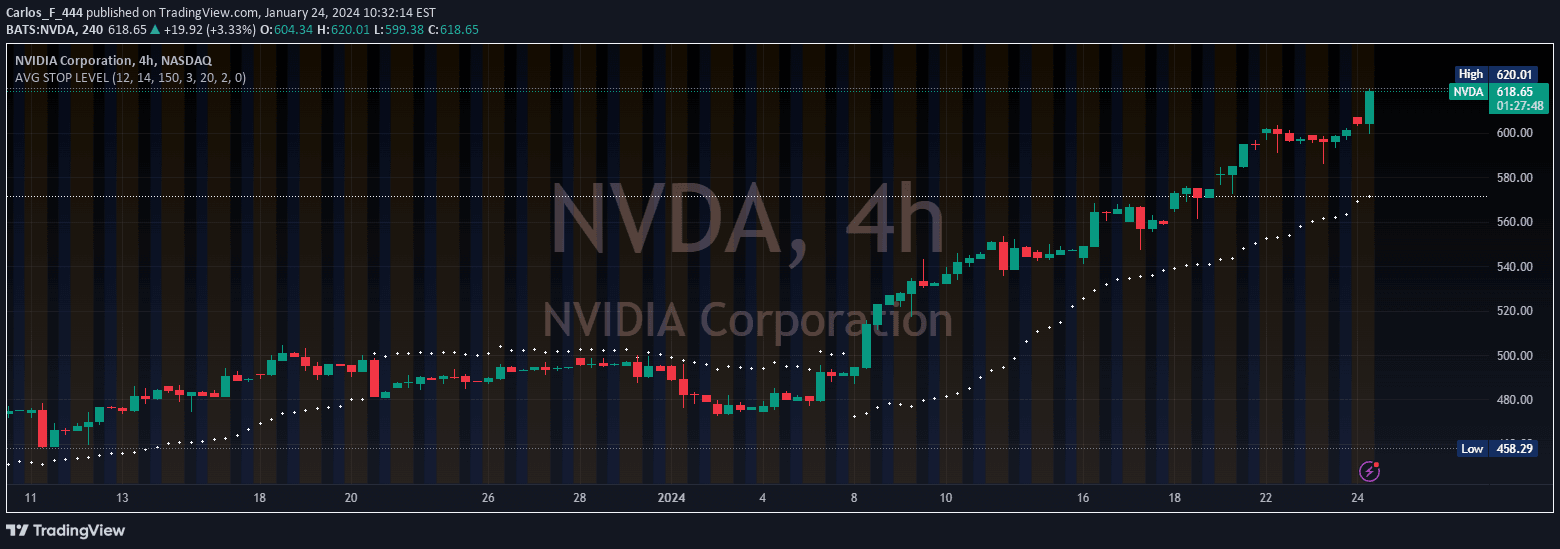
An indicator designed to help traders identify crucial swing points and market structure, providing insights into potential trend changes and key market turning points.
Explore complementary indicator rolesHow it works
The indicator works by analyzing price action and identifying significant market structure points that represent potential trend reversals or continuation. It tracks key levels where price has shown important historical reactions, such as previous highs, lows, or pivot points that represent potential support and resistance zones.
By mapping these critical swing points, the indicator creates a visual framework that helps traders understand the underlying market dynamics. It typically employs algorithmic calculations to detect and highlight these strategic points, allowing traders to see the market's structural landscape more clearly and make more informed trading decisions.
Why it may be useful
Understanding market structure is crucial for traders seeking to make more strategic and informed trading decisions. This indicator provides a systematic approach to identifying key price levels that can serve as potential entry, exit, or stop-loss points, reducing the guesswork in trading.
By revealing the underlying market dynamics, the indicator helps traders anticipate potential trend changes and understand the psychological levels where market participants tend to make significant trading decisions. This insight can lead to more precise trade planning, improved risk management, and a more structured approach to market analysis.
When to explore it
The indicator is most effective in markets with clear trending or ranging characteristics, where price action shows distinct structural patterns. It works particularly well in liquid markets with sufficient price history, such as major forex pairs, stock indices, and heavily traded commodities.
Traders should use this indicator in conjunction with other technical analysis tools to confirm signals and validate potential trade setups. It is especially useful during periods of market transitions, when identifying key support and resistance levels can provide critical insights into potential trend reversals or continuations.
Keep exploring
What we’ve verified
Access, alerts and repainting behaviour have not been independently verified for this indicator. Check the creator’s current publication and settings.
General descriptions and classifications are recovered research. Verified details above identify the specific checks we have completed. Check the creator’s current publication for later changes.