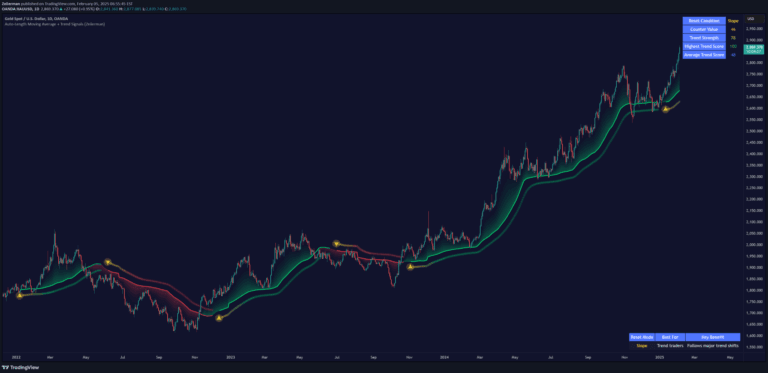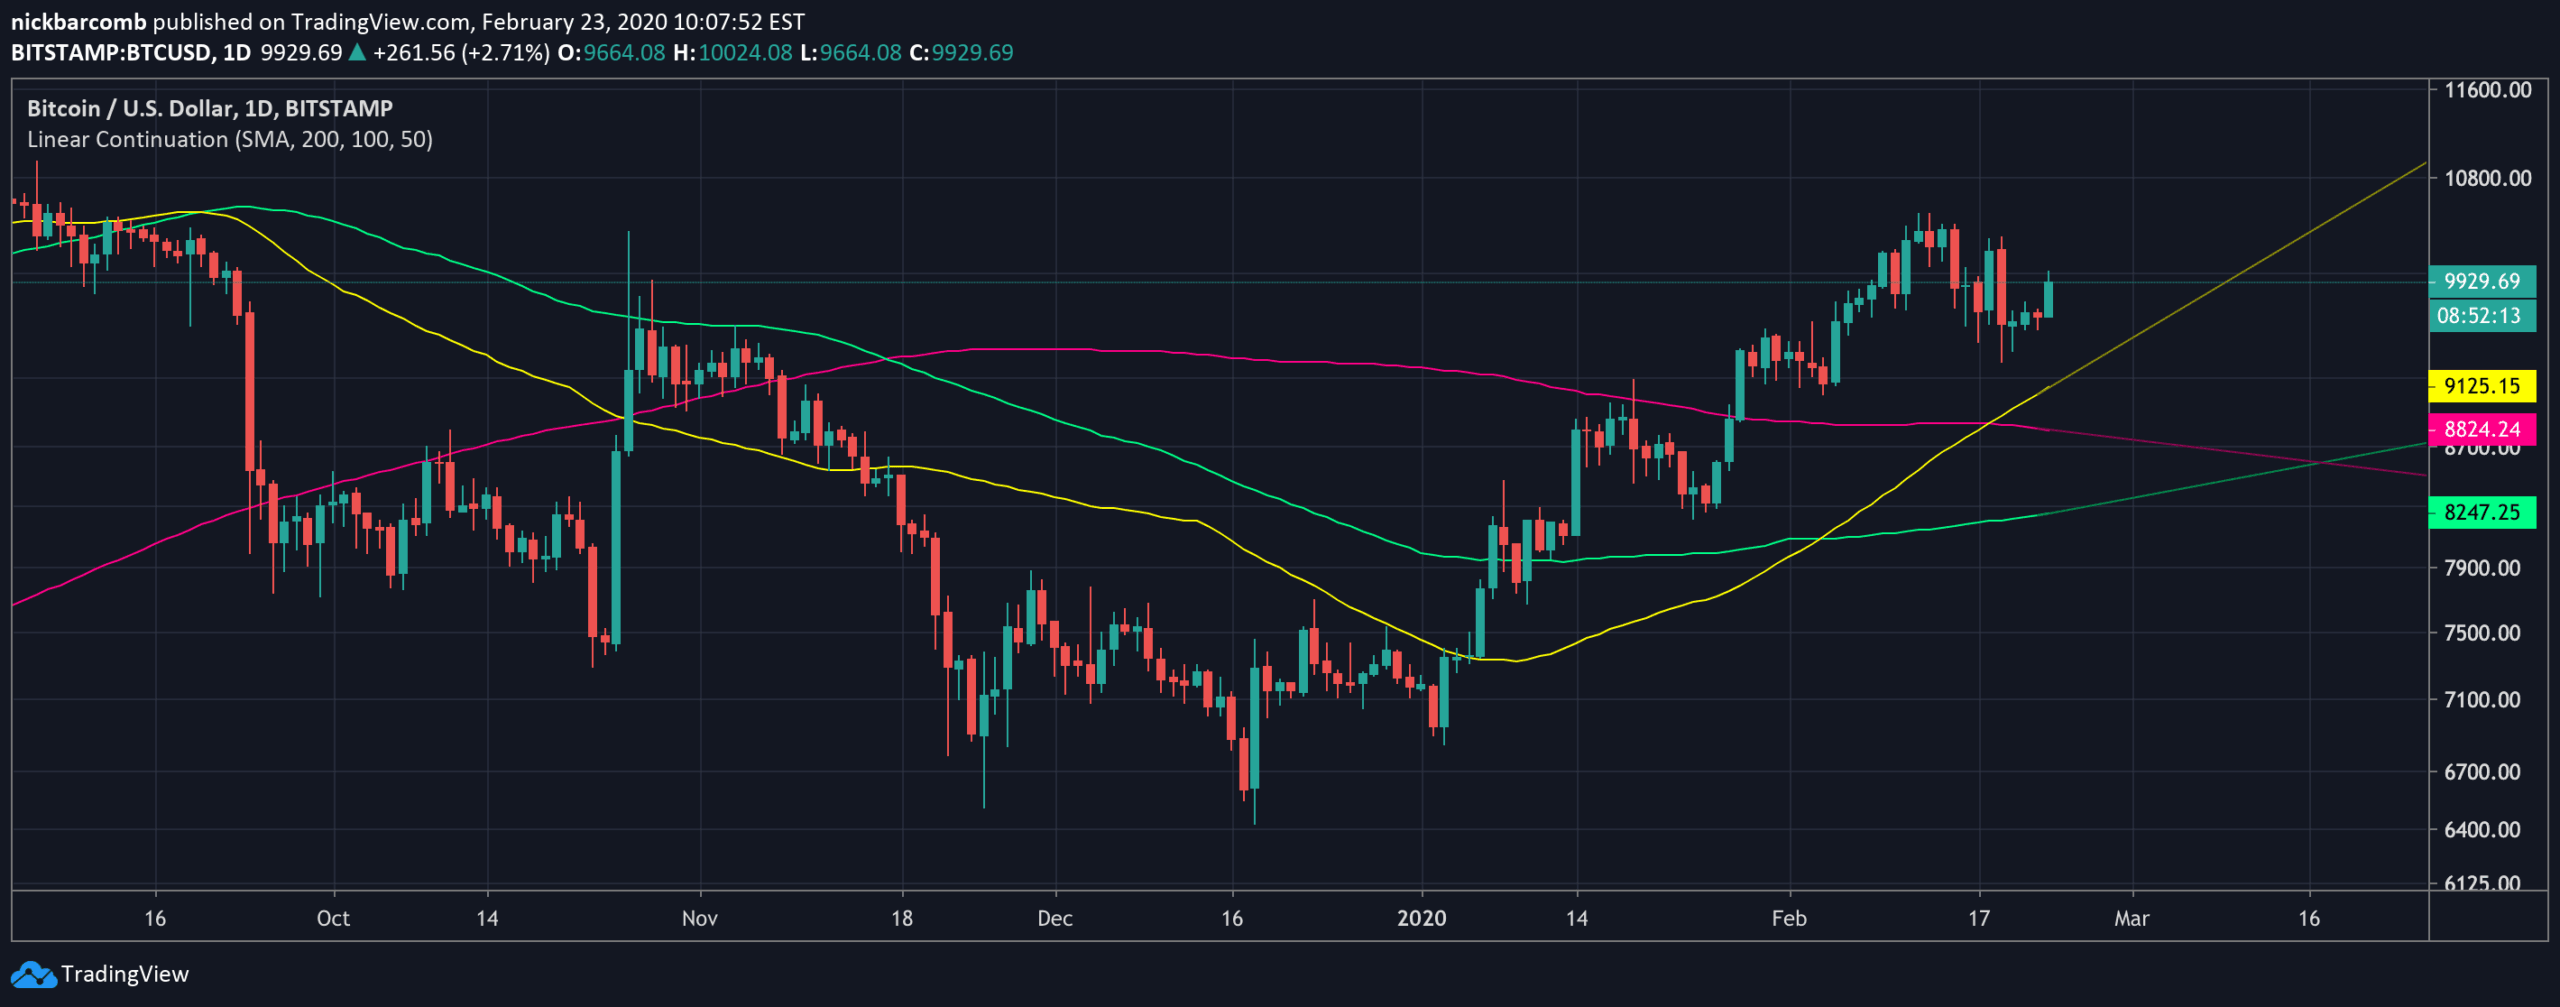
A linear continuation signal using three moving averages to analyze price trend and potential movement direction by comparing multiple moving average lines simultaneously.
Explore complementary indicator rolesHow it works
The linear continuation signal with three moving averages operates by plotting three different moving average lines on a price chart. These lines represent short-term, medium-term, and long-term price trends. By analyzing the relative positions and slopes of these moving averages, traders can identify trend strength and potential continuation patterns.
When shorter-term moving averages cross above or below longer-term moving averages, it signals potential trend changes or confirmations. The lines help smooth out price fluctuations and provide a clearer visual representation of underlying market momentum
Why it may be useful
This signal is crucial for traders because it provides a comprehensive view of price trends across different time horizons. By utilizing multiple moving averages, traders can gain insights into market sentiment and potential trend directions.
The signal helps reduce market noise and offers a more nuanced understanding of price movements. It can help traders make more informed decisions about entry and exit points. The linear continuation approach allows for a systematic analysis of trend strength and potential reversals
When to explore it
The three moving averages signal works best in trending markets with clear directional movements. It is particularly effective in liquid markets with consistent price trends, such as major currency pairs, stock indices, and high-volume commodities.
Traders should use this signal during periods of stable market conditions and avoid using it during extreme volatility or choppy markets. It is most reliable when combined with other technical indicators and fundamental analysis. The signal is especially useful for swing traders seeking to capture multi-day or multi-week price trends
Keep exploring
What we’ve verified
Access, alerts and repainting behaviour have not been independently verified for this indicator. Check the creator’s current publication and settings.
General descriptions and classifications are recovered research. Verified details above identify the specific checks we have completed. Check the creator’s current publication for later changes.