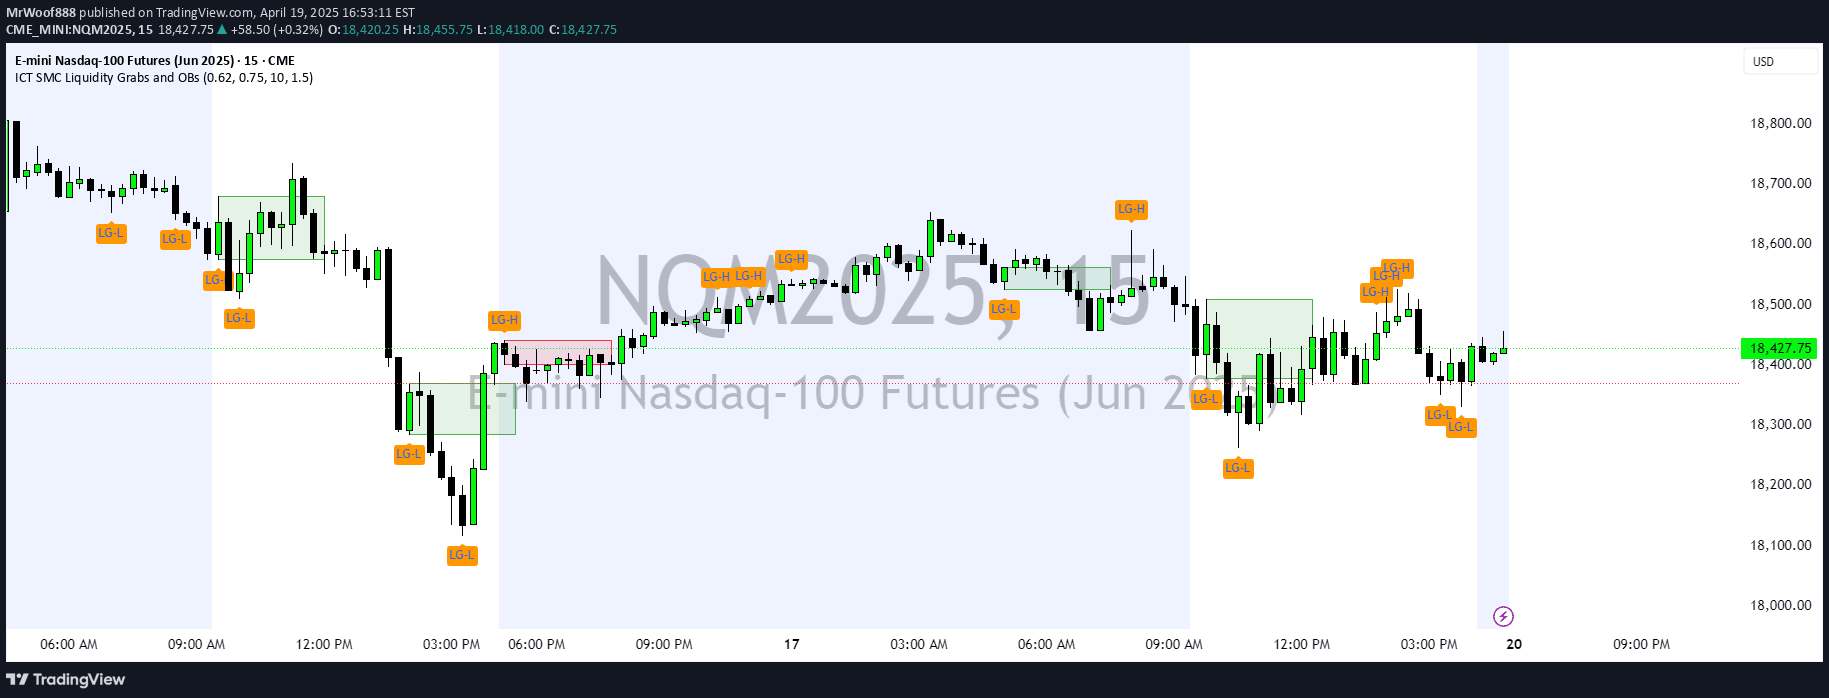
A multi-timeframe liquidity detection tool that identifies engulfing bars sweeping previous candle levels and provides fibonacci entry points for precise trading strategies.
Explore complementary indicator rolesHow it works
The liquidity engulfing detector analyzes price action across six different timeframes to identify specific engulfing bar patterns that sweep liquidity. It evaluates both bullish and bearish scenarios by comparing current and previous candle characteristics, tracking whether the current candle completely engulfs the previous candle and crosses key price levels.
By using smart liquidity detection algorithms, the indicator identifies patterns where price sweeps liquidity zones and then reverses direction. The tool integrates fibonacci levels to provide precise entry points, allowing traders to strategically enter trades based on confirmed pattern recognition and multi-timeframe analysis.
Why it may be useful
Multi-timeframe liquidity detection provides traders with a comprehensive view of market structure and potential reversal zones that might be invisible on a single timeframe. By identifying where liquidity has been swept and potential trend reversals are likely, traders can make more informed trading decisions with enhanced probability.
The fibonacci integration adds an extra layer of precision, enabling traders to identify exact entry levels with higher confidence. This approach transforms raw price action into a strategic framework for understanding market dynamics and potential turning points in different market conditions.
When to explore it
The liquidity engulfing detector works best in markets with clear price action and sufficient liquidity, such as major forex pairs, stock indices, and high-volume cryptocurrency markets. Traders should utilize this tool when seeking to identify potential trend reversals and liquidity sweep scenarios across multiple timeframes.
It is particularly effective during periods of market transition, ranging markets, and when looking to enter trades with defined risk parameters. Traders should combine this indicator with other confirmation signals and maintain strict risk management protocols to maximize its potential.
Keep exploring
What we’ve verified
Access, alerts and repainting behaviour have not been independently verified for this indicator. Check the creator’s current publication and settings.
General descriptions and classifications are recovered research. Verified details above identify the specific checks we have completed. Check the creator’s current publication for later changes.