
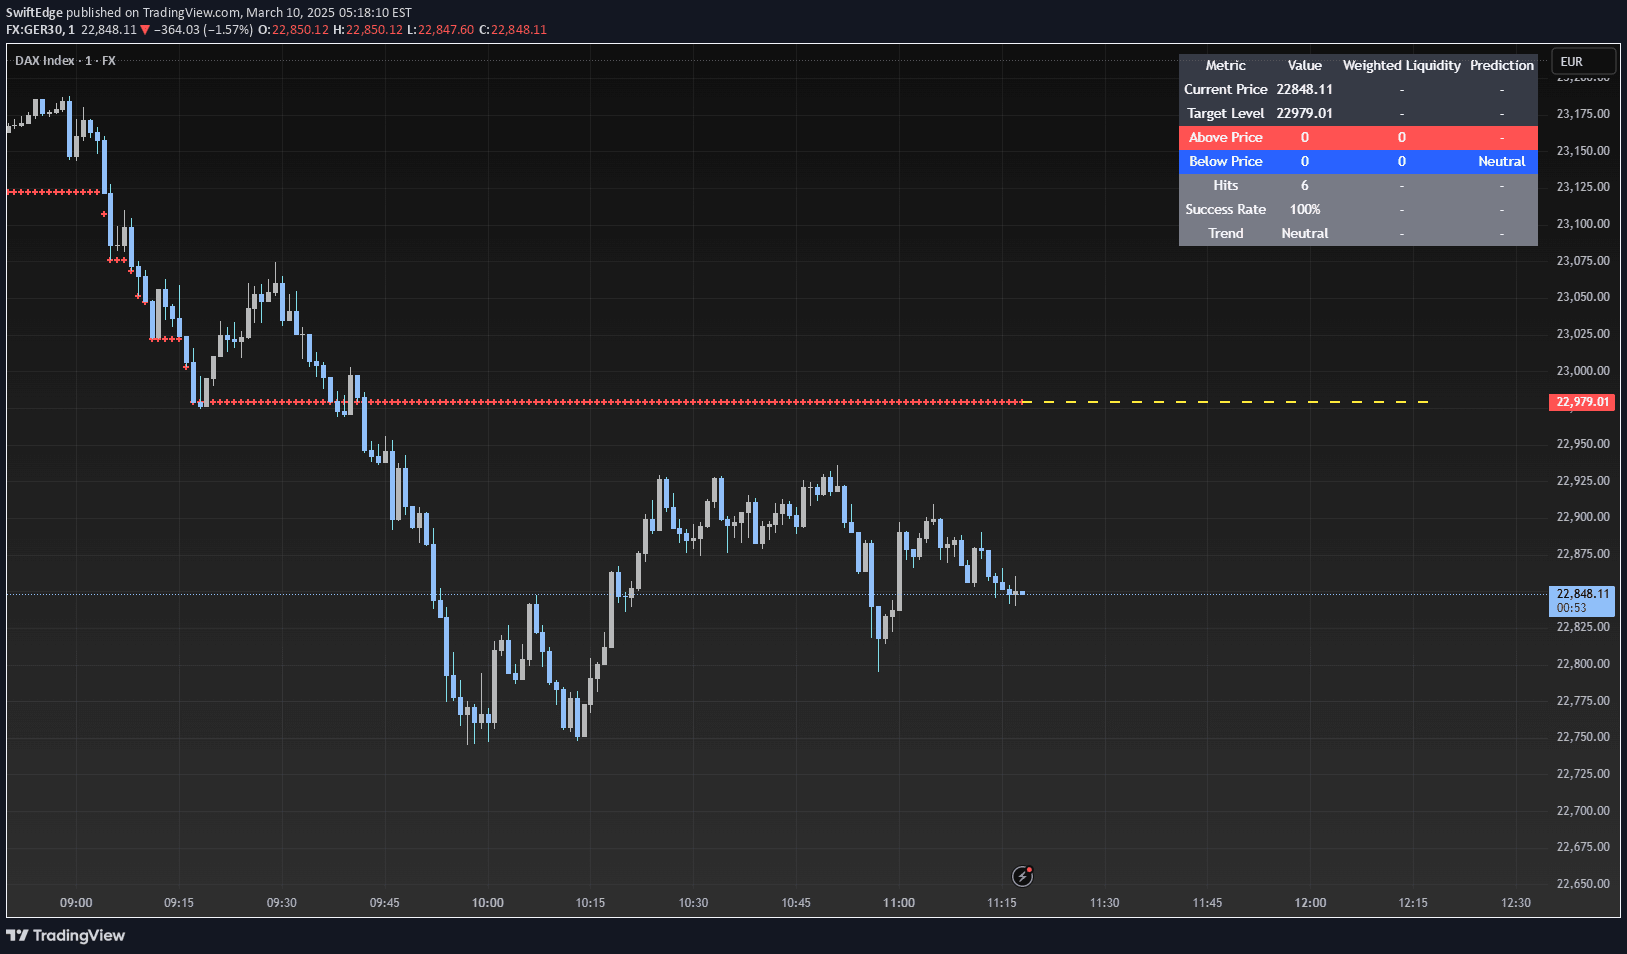
A dynamic liquidity hunting dashboard that identifies potential market movement targets by analyzing swing points, volume, and trend using technical analysis tools.
Explore complementary indicator rolesHow it works
The Liquidity Hunt Dashboard operates by analyzing market dynamics through technical indicators like Simple Moving Average (SMA) and pivot points. It calculates potential liquidity zones by tracking swing points and creating a dynamic target line that adjusts automatically when price reaches the current target.
The indicator uses a complex algorithm to assess market trend direction, placing a yellow dashed line representing the next expected liquidity level within approximately 20 pips. It continuously updates its prediction based on current market conditions, displaying whether the market is chasing buy or sell liquidity, and providing real-time trend insights.
Why it may be useful
This dashboard provides traders with a comprehensive visual tool for understanding market liquidity and potential price movements across different asset classes. By offering dynamic target lines and trend predictions, it helps traders make more informed decisions by presenting complex market analysis in an easily digestible format.
The indicator's ability to adapt to different markets like indices, crypto, and forex makes it a versatile tool for traders seeking to understand potential price trajectories. Its daily statistics tracking and automatic updates provide traders with continuous insights into market behavior and potential entry or exit points.
When to explore it
The Liquidity Hunt Dashboard is most effective when used on shorter timeframes like 1-minute and 5-minute charts, particularly for volatile markets such as cryptocurrency and indices. Traders can leverage this tool during active trading sessions when market movements are more pronounced and liquidity zones are more likely to be tested.
It is particularly useful for traders seeking to identify potential market turning points, understand trend dynamics, and make quick, informed trading decisions. The indicator's flexibility in adjusting settings for different timeframes and markets makes it a valuable tool for traders across various skill levels and trading styles.
Keep exploring
What we’ve verified
Access, alerts and repainting behaviour have not been independently verified for this indicator. Check the creator’s current publication and settings.
General descriptions and classifications are recovered research. Verified details above identify the specific checks we have completed. Check the creator’s current publication for later changes.


