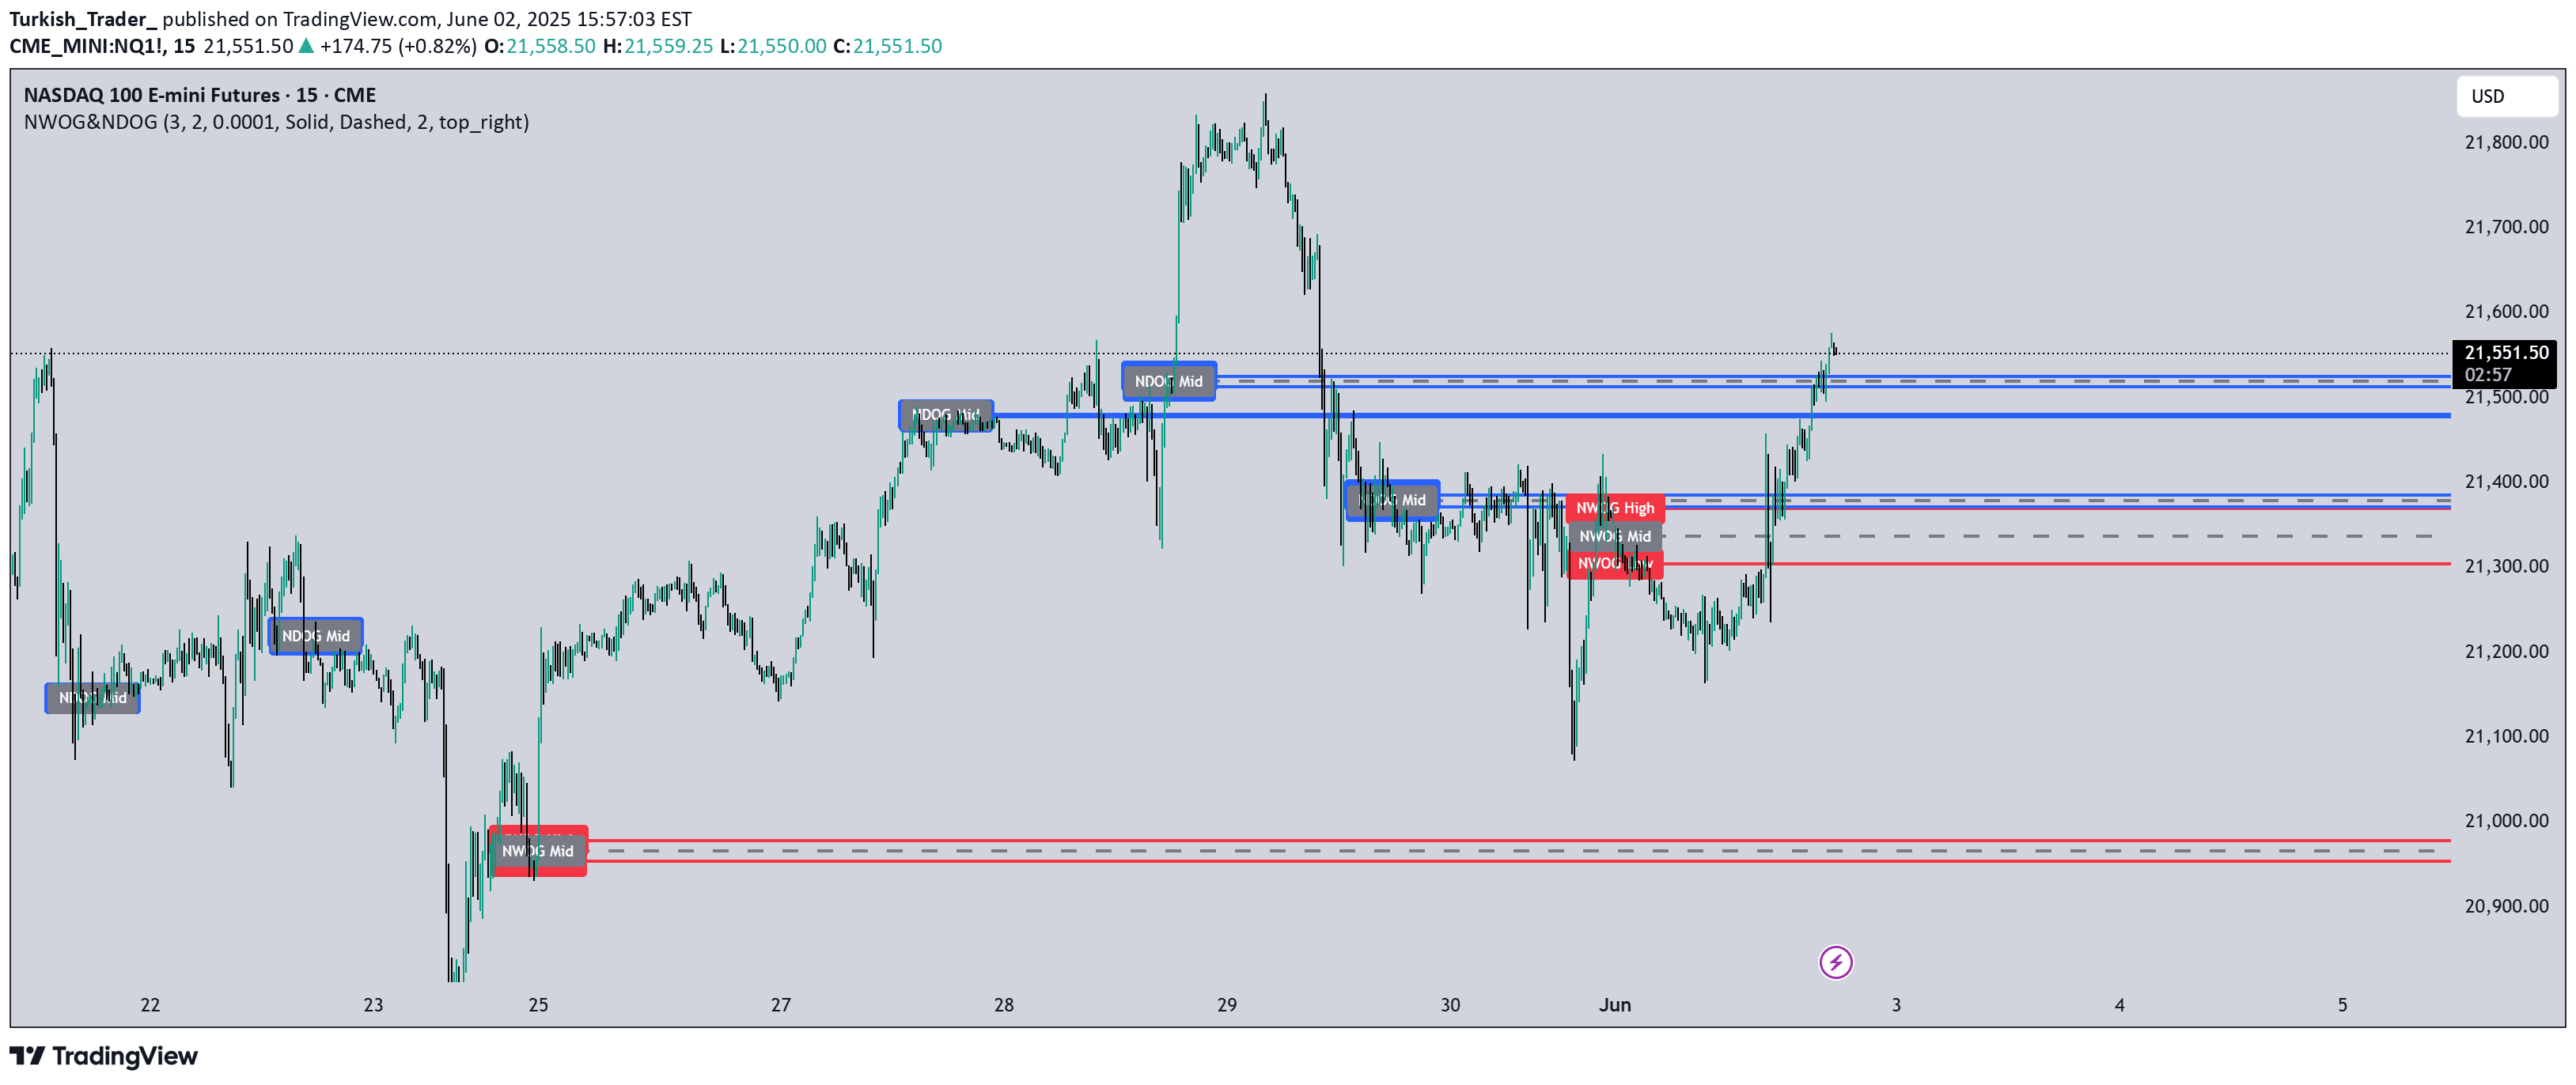
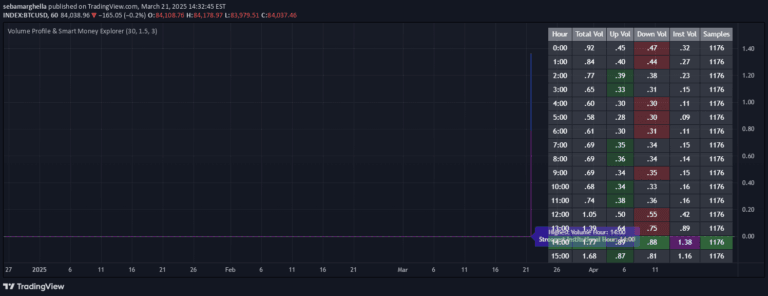
A liquidity indicator that identifies local price highs and lows to help traders spot potential reversal or continuation zones based on market liquidity conditions.
Explore complementary indicator rolesHow it works
The Liquidity Indicator calculates local highs and lows by analyzing price action over a specified lookback period. It identifies recent peaks and troughs, marking them as potential key liquidity zones where significant price movements might occur.
Red lines represent local highs, indicating recent price rejection points, while green lines show local lows that might serve as potential support levels. By continuously plotting these levels in real-time, traders can dynamically track evolving market liquidity conditions.
Why it may be useful
This indicator provides traders with critical insights into market structure by highlighting areas of potential price interest and liquidity concentration. By revealing key levels where price has historically reversed or found support, traders can make more informed decisions about potential entry and exit points.
Understanding liquidity zones helps traders anticipate potential market movements, reduce risk, and develop more strategic trading approaches. The visual representation of these levels allows for quick recognition of important price regions that might otherwise be overlooked.
When to explore it
The Liquidity Indicator is most effective in markets with clear price action and during periods of moderate to high trading activity. It works particularly well when combined with other technical analysis tools to confirm potential trading signals and validate market sentiment.
Traders can leverage this indicator across various timeframes, from scalping to swing trading, by adjusting the lookback period to match their specific trading strategy. It is especially useful in identifying potential reversal points or continuation zones in trending and range-bound markets.
Keep exploring
What we’ve verified
Access, alerts and repainting behaviour have not been independently verified for this indicator. Check the creator’s current publication and settings.
General descriptions and classifications are recovered research. Verified details above identify the specific checks we have completed. Check the creator’s current publication for later changes.