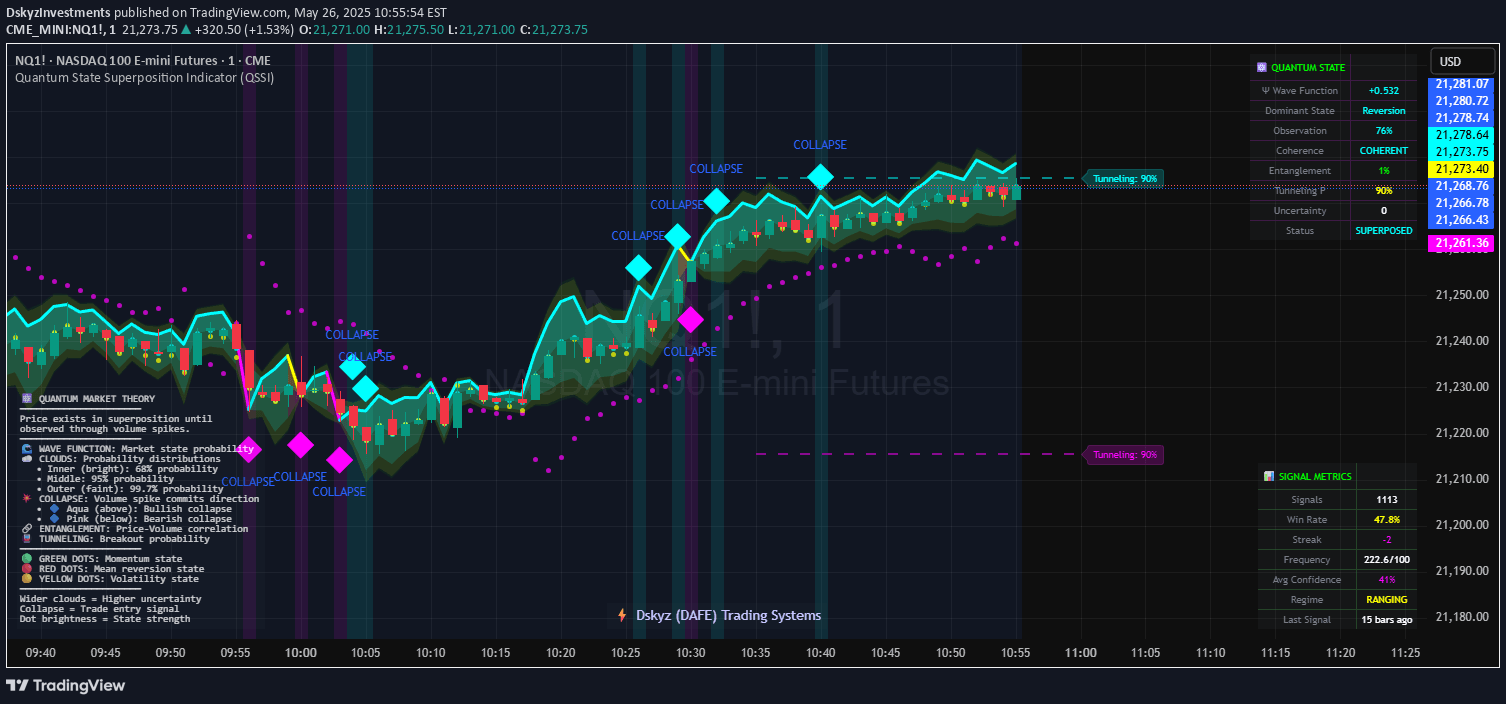
A specialized indicator tracking the most volatile London session manipulation candle, helping traders identify key intraday market movements during specific time windows.
Explore complementary indicator rolesHow it works
The ICT Manipulation Candle indicator analyzes price action during the London trading session, specifically between 3:00 AM to 5:00 AM New York time. It identifies the most volatile candle based on range and volume, highlighting this key manipulation point directly on the chart.
The script works on 1-minute, 5-minute, or 15-minute timeframes to ensure high accuracy and alignment with Inner Circle Trader (ICT) intraday trading concepts. It dynamically tracks and marks the most significant candle during the specified session timeframe, providing traders with a visual anchor for potential market manipulation points.
Why it may be useful
This indicator is crucial for traders seeking to understand intraday market dynamics and potential manipulation zones during the volatile London trading session. By highlighting the most significant candle, it helps traders identify key market turning points and potential entry or exit opportunities.
The visual representation allows traders to quickly recognize important price action moments that might otherwise be overlooked. It provides a strategic advantage by focusing on the most volatile period of the trading day, helping traders make more informed decisions based on market movement and potential manipulation strategies.
When to explore it
The ICT Manipulation Candle indicator is most effective for intraday traders focusing on the London trading session, particularly those interested in short-term, high-precision trading strategies. It works best during periods of high market volatility, especially when tracking potential market manipulation points.
Traders should use this indicator when seeking to identify key market movements within a specific, limited timeframe. It is particularly valuable for those following ICT concepts and looking to understand the subtle dynamics of price action during the most active part of the London trading session.
Keep exploring
What we’ve verified
Access, alerts and repainting behaviour have not been independently verified for this indicator. Check the creator’s current publication and settings.
General descriptions and classifications are recovered research. Verified details above identify the specific checks we have completed. Check the creator’s current publication for later changes.