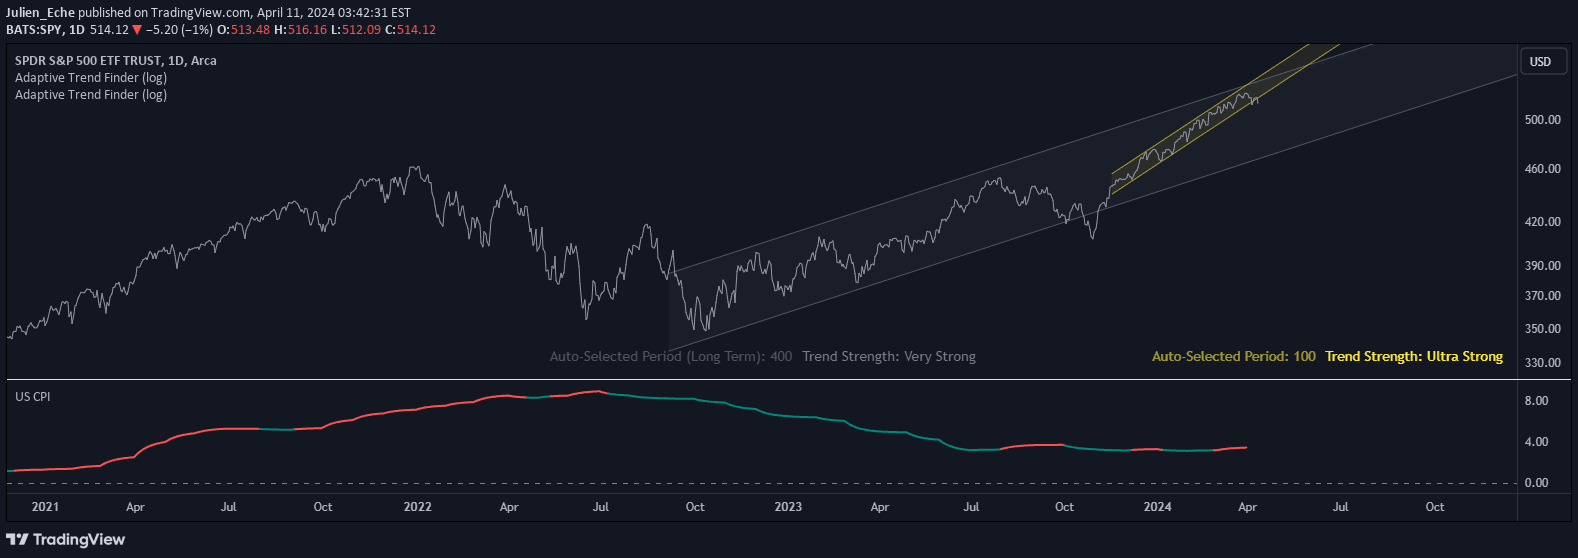
A normalization technique using natural logarithm to process large economic data values, applying SMA for smoother trend analysis across different financial metrics.
Explore complementary indicator rolesHow it works
The natural log indicator transforms large numerical values by applying a logarithmic function, which compresses the scale and reduces extreme variations. This mathematical transformation helps normalize data points that have significant differences in magnitude, making them more comparable and analytically manageable.
By applying a Simple Moving Average (SMA) to the logarithmically transformed data, the indicator further smooths out fluctuations and provides a more stable representation of the underlying trend. This approach is particularly useful for economic indicators with massive values that might otherwise be challenging to analyze directly.
Why it may be useful
Logarithmic normalization enables traders and analysts to compare and analyze financial metrics that would otherwise be difficult to interpret due to their vastly different scales. By compressing large values, the indicator reveals underlying patterns and trends that might be obscured by raw numerical differences.
The technique is especially valuable for economic data such as Gross Domestic Income (GDI), Federal Reserve Balance Sheet, and monetary supply metrics, where absolute values can be enormous and year-over-year comparisons might not provide meaningful insights.
When to explore it
This normalization technique is most effective when dealing with financial or economic data that involves extremely large numerical values with potentially non-linear growth characteristics. It is particularly useful for long-term trend analysis where raw data might be too volatile or difficult to interpret.
Traders and economists can apply this method when examining macro-economic indicators, financial institution balance sheets, monetary aggregates, and other complex datasets that require sophisticated statistical transformation to reveal meaningful trends and relationships.
Keep exploring
What we’ve verified
Access, alerts and repainting behaviour have not been independently verified for this indicator. Check the creator’s current publication and settings.
General descriptions and classifications are recovered research. Verified details above identify the specific checks we have completed. Check the creator’s current publication for later changes.