
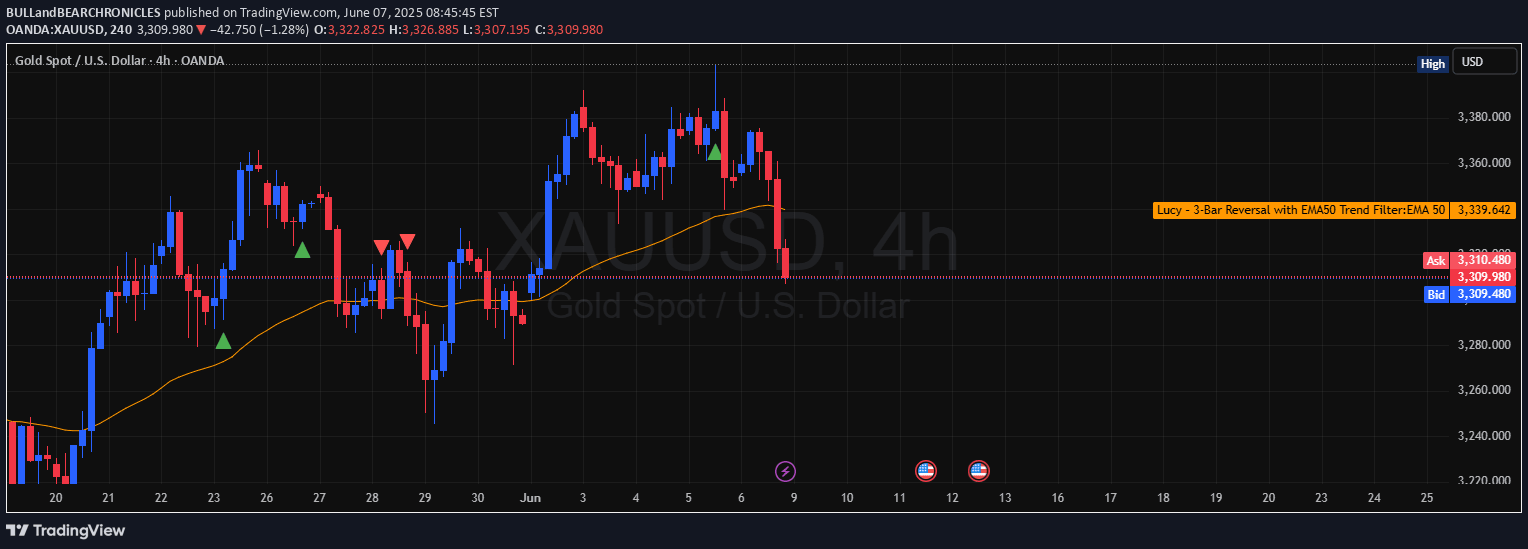
A trend-following trading signal that identifies 3-bar reversal patterns aligned with the EMA50 trend, offering clean price-action entry points for traders.
Explore complementary indicator rolesHow it works
The Lucy signal identifies 3-bar reversal patterns by analyzing three consecutive price bars with specific characteristics. For a bullish setup, the first bar must be bearish, the second bar makes a lower low, and the third bar is bullish, closing above the second bar's high. A bearish setup follows the opposite pattern, with the first bar bullish, second bar making a higher high, and third bar bearish, closing below the second bar's low.
Crucially, the signal incorporates an EMA50 trend filter, ensuring that the reversal pattern aligns with the broader market trend. This means bullish signals must occur above the EMA50, while bearish signals must occur below it, adding an extra layer of trend confirmation to the trading strategy.
Why it may be useful
The Lucy signal provides traders with a disciplined, systematic approach to identifying potential trend reversals and entry points. By combining a specific price action pattern with a trend filter, the indicator helps traders avoid false signals and improve their trade selection process. It offers a clear, visual representation of potential trade opportunities through color-coded triangles, making it easier to spot and interpret market movements.
Moreover, the signal's flexibility across different timeframes makes it a versatile tool for various trading styles. Its trend-following nature helps traders align their trades with the dominant market direction, potentially reducing the risk of trading against the primary trend and improving overall trading performance.
When to explore it
The Lucy signal works best in markets with clear trending characteristics, where price is consistently moving in a defined direction. It is particularly effective on intraday timeframes like 15-minute and 1-hour charts, as well as swing trading timeframes such as 4-hour and daily charts. Traders should look for markets with sufficient volatility and clear price action to maximize the signal's effectiveness.
The signal is most reliable in liquid markets with consistent price movements, such as major forex pairs, stock indices, and highly traded commodities. Traders should combine this signal with other technical analysis tools and risk management strategies to validate trade opportunities and manage potential drawdowns.
Keep exploring
What we’ve verified
Access, alerts and repainting behaviour have not been independently verified for this indicator. Check the creator’s current publication and settings.
General descriptions and classifications are recovered research. Verified details above identify the specific checks we have completed. Check the creator’s current publication for later changes.



