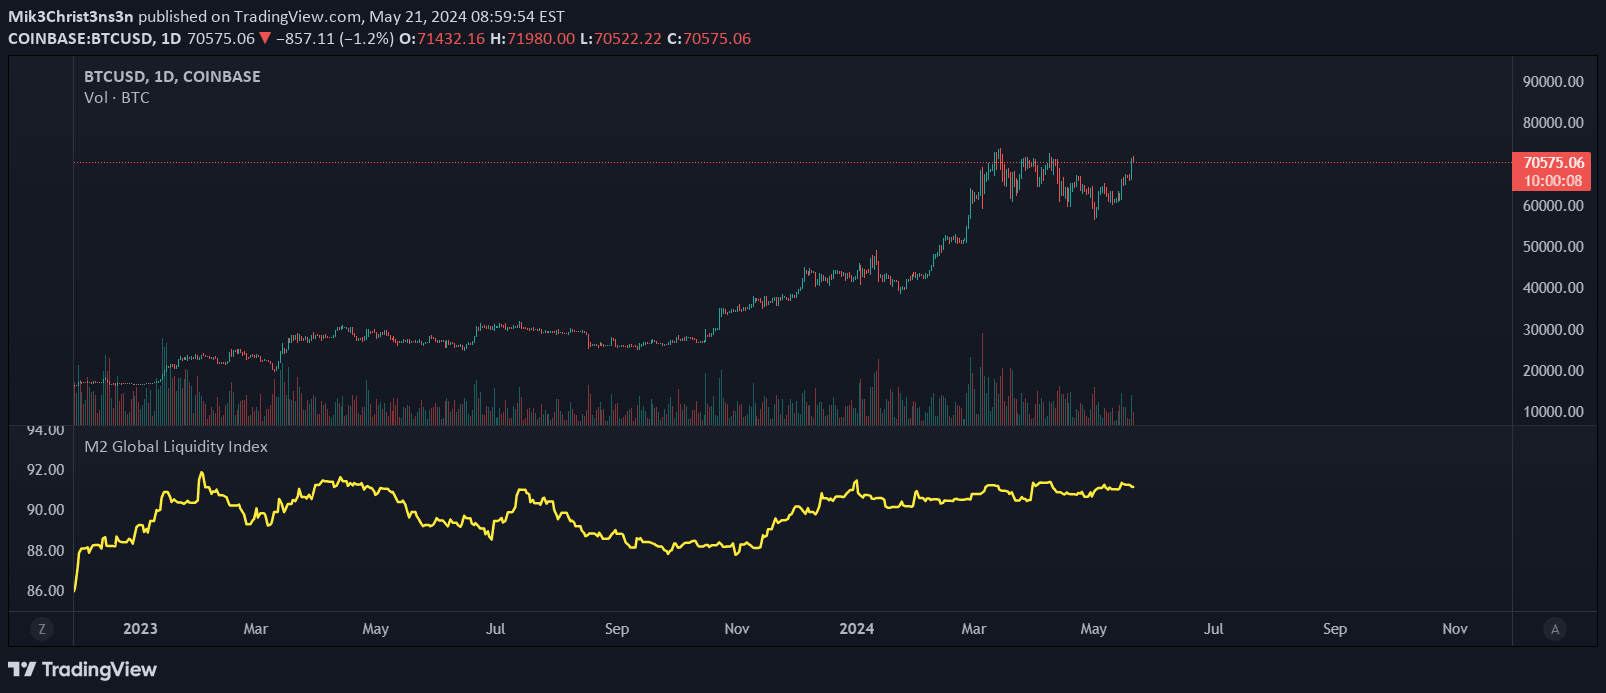
A comprehensive indicator tracking M2 money supply across five major economies, enabling advanced time-shift analysis for global liquidity correlation studies.
Explore complementary indicator rolesHow it works
The M2 Global Liquidity Index collects and processes M2 money supply data from five major economies: US, China, Eurozone, Japan, and UK. It converts all values to USD in real-time, creating a unified global liquidity metric that can be time-shifted between -1000 and +1000 days.
By utilizing an advanced time-shift mechanism with shape preservation, the indicator allows traders to analyze monetary data across different time periods. The algorithm maintains data integrity while enabling flexible temporal analysis, providing a sophisticated tool for understanding complex economic relationships.
Why it may be useful
This indicator offers traders unprecedented insight into global monetary conditions by aggregating money supply data from major economies. It provides a macro-level view of liquidity trends, helping investors understand broader economic dynamics that can significantly impact financial markets.
By enabling time-shifted analysis, traders can explore potential correlations between money supply changes and asset price movements. This comprehensive approach allows for deeper understanding of monetary policy effects, central bank actions, and potential market trend shifts across different economic regions.
When to explore it
The M2 Global Liquidity Index is most effective for long-term strategic analysis, particularly for swing traders and macro-oriented investors. It works best when examining extended market trends, comparing monetary policies across different economies, and identifying potential leading indicators for broader economic shifts.
Traders should leverage this tool during periods of significant monetary policy changes, economic transitions, or when studying complex inter-market relationships. It is particularly valuable for understanding long-term capital flow dynamics and potential future market movements based on liquidity trends.
Keep exploring
What we’ve verified
Access, alerts and repainting behaviour have not been independently verified for this indicator. Check the creator’s current publication and settings.
General descriptions and classifications are recovered research. Verified details above identify the specific checks we have completed. Check the creator’s current publication for later changes.