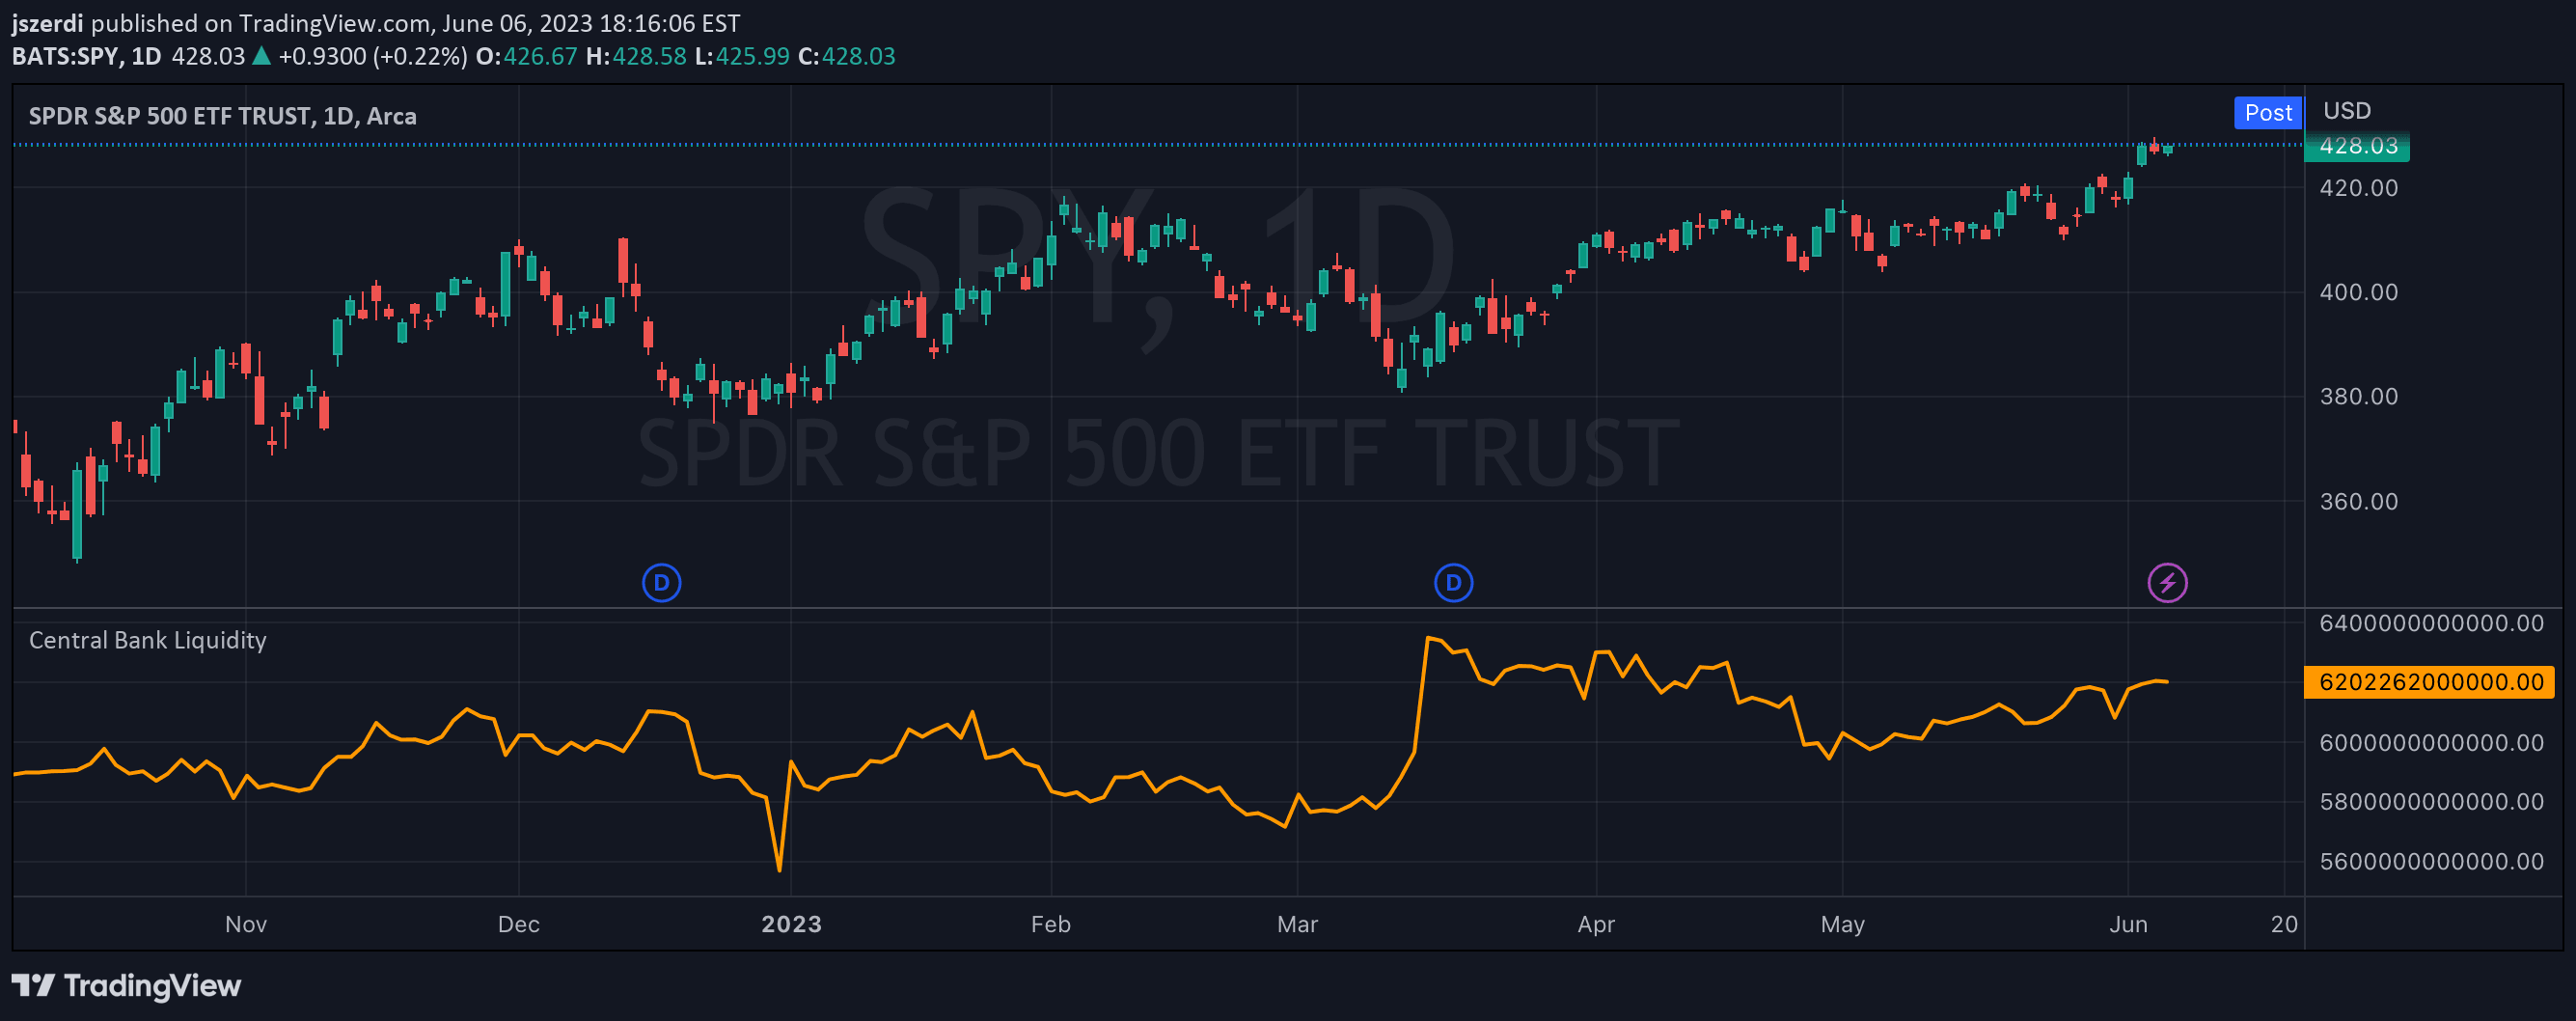
Tracks major central banks' balance sheets to analyze global liquidity levels and potential market impacts by monitoring asset size and monetary policy trends.
Explore complementary indicator rolesHow it works
The indicator aggregates balance sheet data from four major central banks: the European Central Bank (ECB), People's Bank of China (PBoC), Federal Reserve (Fed), and Bank of Japan (BOJ). It plots their total assets over time, creating a comprehensive view of global monetary liquidity by tracking the size of each bank's financial assets.
A black line representing the average assets provides a smoothed overview of collective central bank balance sheet movements, helping traders understand the net liquidity effect across these critical financial institutions.
Why it may be useful
Central bank balance sheets are crucial indicators of global economic health and monetary policy direction, directly influencing financial markets and asset prices. By monitoring these balance sheets, traders can gain insights into potential market liquidity shifts and anticipate broader economic trends.
Understanding central bank asset levels helps investors predict potential market movements, interest rate changes, and overall economic sentiment. These balance sheet trends can signal expansion or contraction of monetary policy, which can significantly impact investment strategies across different asset classes.
When to explore it
This indicator is most effective when analyzing longer-term market trends and making strategic investment decisions across multiple timeframes. It works best on daily or weekly charts where longer-term monetary policy shifts become more apparent and meaningful.
Traders should use this indicator when seeking to understand broader economic contexts, particularly during periods of potential monetary policy changes, economic uncertainties, or significant global financial events that might influence central bank actions.
Keep exploring
What we’ve verified
Access, alerts and repainting behaviour have not been independently verified for this indicator. Check the creator’s current publication and settings.
General descriptions and classifications are recovered research. Verified details above identify the specific checks we have completed. Check the creator’s current publication for later changes.