
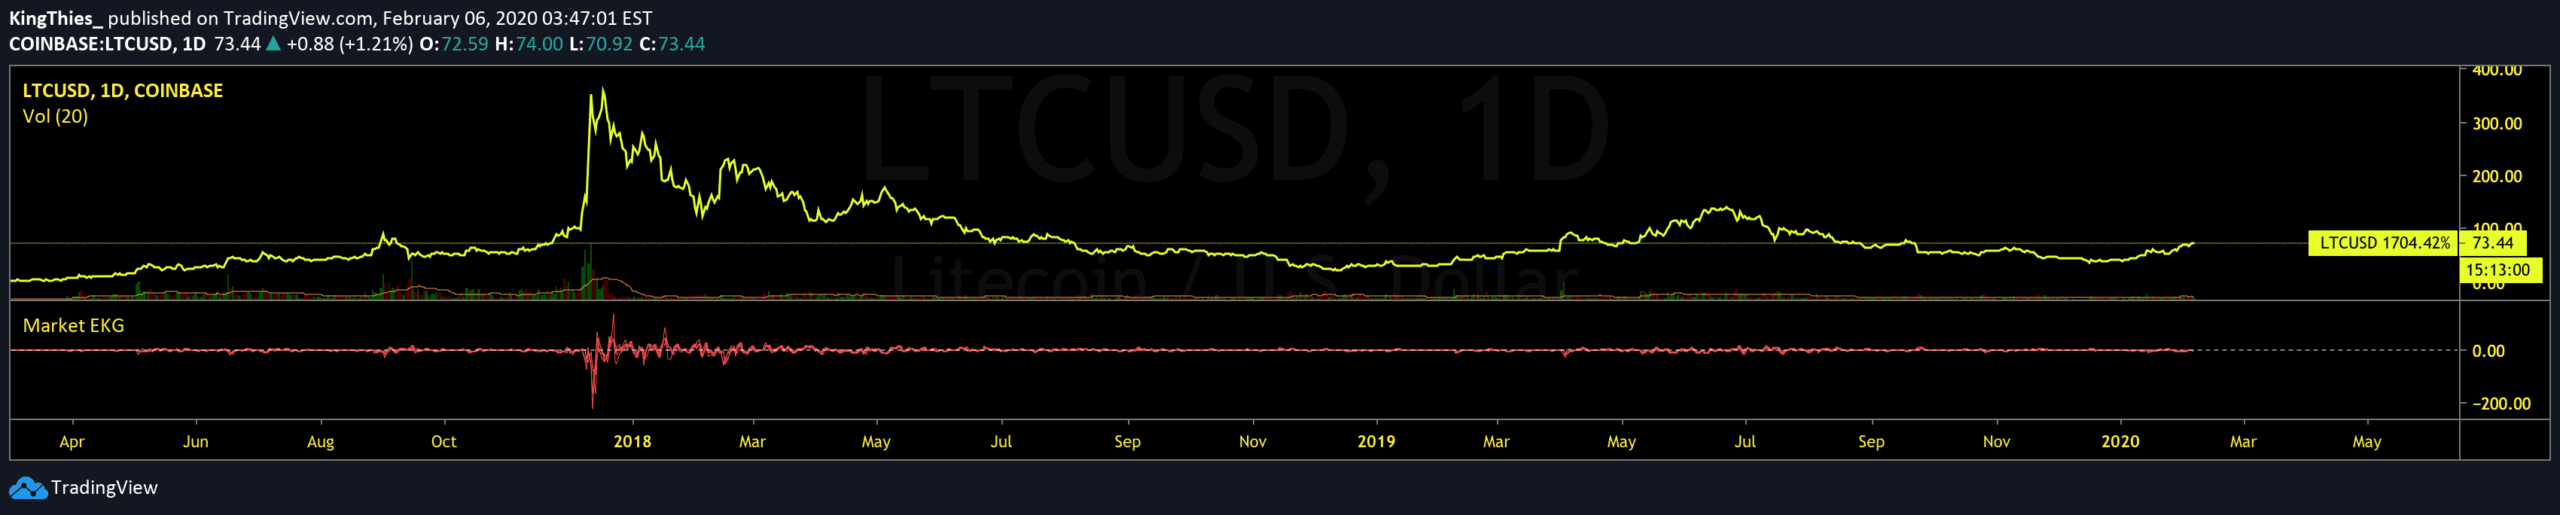
An EKG-like oscillator that measures price volatility by comparing previous period OHLC averages, providing insights into market dynamics without traditional volume indicators.
Explore complementary indicator rolesHow it works
The indicator calculates differences between previous four-period OHLC inputs and compares them to recently closed candle inputs. It creates an oscillator by analyzing relative price averages across multiple periods.
The script takes previous period Open, High, Low, and Close (OHLC) values and computes their averages. By comparing the most recent period to previous trend averages, it generates a volatility measure. The differences are plotted as an oscillating line, similar to an EKG medical chart, revealing price movement dynamics
Why it may be useful
This indicator provides traders with a unique perspective on market volatility without relying on traditional volume-based measures. It is particularly valuable in markets with limited volume data or restricted volume indicator usage.
The EKG-like visualization helps traders quickly understand price fluctuations and potential trend changes. By offering a price-based volatility metric, it enables more comprehensive market analysis across different financial instruments and indexes
When to explore it
The indicator works best in markets with limited volume data or where traditional volume indicators are not applicable. It is most effective during periods of significant price movement and potential trend transitions.
Traders can utilize this tool to identify potential volatility shifts, confirm trend strength, and make more informed trading decisions. It is particularly useful for indexes, tickers, and markets with restricted volume measurements
Keep exploring
What we’ve verified
Access, alerts and repainting behaviour have not been independently verified for this indicator. Check the creator’s current publication and settings.
General descriptions and classifications are recovered research. Verified details above identify the specific checks we have completed. Check the creator’s current publication for later changes.


