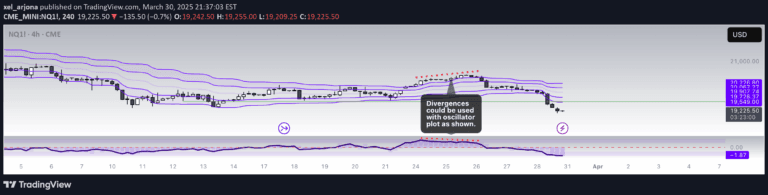
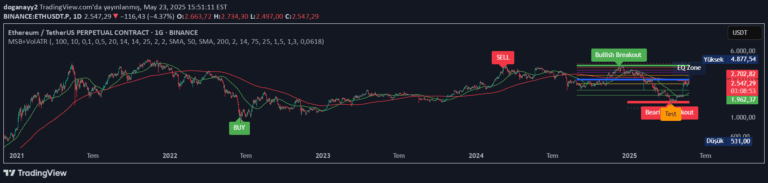
A trading tool that identifies low volatility market periods by analyzing price movement over a specified window, highlighting potential quiet zones before potential breakouts.
Explore complementary indicator rolesHow it works
The Market Sleep Zones script calculates the average price movement over a specified number of bars, typically 20, to determine market volatility. It measures the price changes and compares them against a predefined threshold to identify periods of low market activity.
When the price fluctuations remain below the set percentage, the indicator marks the area with a soft green background, effectively creating a visual representation of market 'sleeping' zones. These zones help traders recognize periods of consolidation or potential upcoming market movements.
Why it may be useful
Identifying low volatility periods is crucial for traders as it can signal potential upcoming market shifts or consolidation phases. By recognizing these quiet zones, traders can better prepare for potential breakouts and adjust their trading strategies accordingly.
The Market Sleep Zones indicator provides a visual tool to understand market dynamics, helping traders avoid getting caught in choppy or range-bound markets. It offers insights into market sentiment and potential transitional periods, which can be valuable for making more informed trading decisions.
When to explore it
The Market Sleep Zones indicator is most effective during periods of market uncertainty or when traders want to avoid low-activity trading environments. It works best in markets with clear trend potential and can help identify consolidation phases before significant price movements.
Traders can use this tool across various timeframes and markets, adjusting the window size and volatility threshold to suit their specific trading style and instrument. It is particularly useful for traders looking to minimize risk during low-activity periods and prepare for potential breakout opportunities.
Keep exploring
What we’ve verified
Access, alerts and repainting behaviour have not been independently verified for this indicator. Check the creator’s current publication and settings.
General descriptions and classifications are recovered research. Verified details above identify the specific checks we have completed. Check the creator’s current publication for later changes.