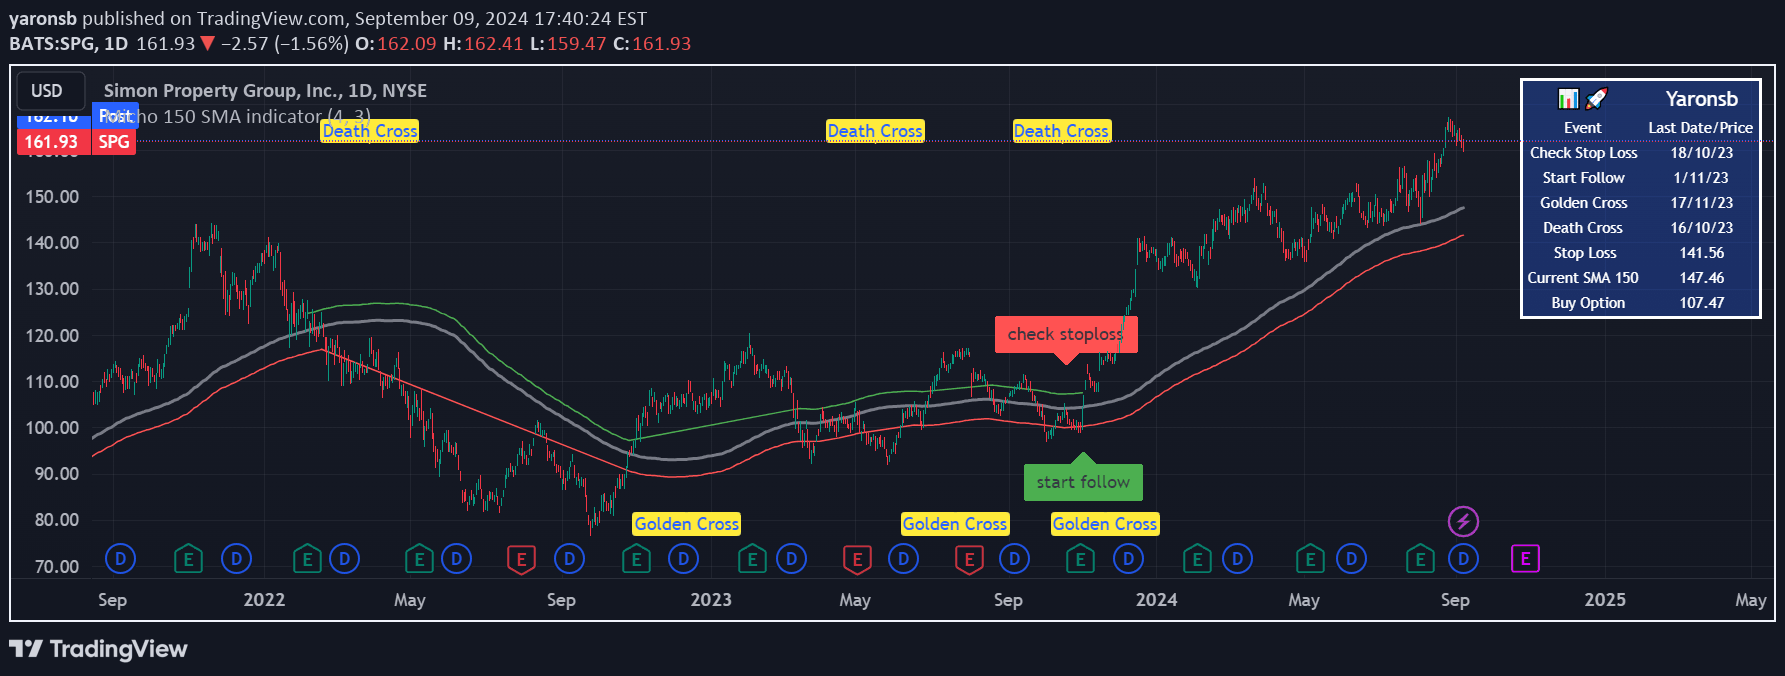
A trading indicator using 150-day SMA to track market trends, generate buy/sell signals, and identify potential trend changes through Golden Cross and Death Cross events.
Explore complementary indicator rolesHow it works
The indicator calculates a 150-day Simple Moving Average (SMA) by tracking the average closing prices over 150 trading days. This moving average is plotted on the chart to help visualize the overall market trend and provide a baseline for potential trading decisions.
Additionally, the script identifies key crossover events such as when the closing price crosses above or below the 150-day SMA, which generates buy and sell signals. It also tracks Golden Cross and Death Cross events by monitoring the relationship between 50-day and 200-day SMAs, providing further insights into potential trend changes.
Why it may be useful
Moving averages are crucial tools for traders seeking to understand market momentum and potential trend directions. By smoothing out price fluctuations, the 150-day SMA helps traders filter out short-term noise and focus on more significant market movements.
The additional features like stop loss calculations and crossover signals provide traders with risk management strategies and potential entry and exit points. Identifying Golden Cross and Death Cross events can offer early warnings about significant trend reversals, helping traders make more informed investment decisions.
When to explore it
This indicator is most effective for swing traders and long-term investors who are interested in capturing broader market trends rather than short-term price movements. It works best in markets with clear directional trends where moving averages can provide meaningful insights into potential market direction.
Traders should use this indicator in conjunction with other technical and fundamental analysis tools to confirm signals and reduce the risk of false positives. It is particularly useful in analyzing broad market indices, sector ETFs, and stocks with relatively stable price behavior.
Keep exploring
What we’ve verified
Access, alerts and repainting behaviour have not been independently verified for this indicator. Check the creator’s current publication and settings.
General descriptions and classifications are recovered research. Verified details above identify the specific checks we have completed. Check the creator’s current publication for later changes.